If you're still hesitant, keep reading — we've cultivated a list of email marketing statistics for HubSpot to demonstrate just how powerful email can be. Here, you’ll find:
- Email Marketing Stat Highlights for 2023
- General Email Marketing Statistics
- Email Marketing Metrics Statistics
- AI Email Marketing Statistics
- B2B Email Marketing Statistics
- Mobile Marketing Statistics
- B2C Email Marketing Statistics
- Email Marketing Demographics for 2023
Email Marketing Stats (Highlights)
- There are 4 billion daily email users.
- 37% of brands are increasing their email budget.
- A majority of marketers using email leverage mobile-friendly emails as part of their marketing strategy.
- Segmented emails drive 30% more opens and 50% more clicksthroughs than unsegmented ones.
- Most marketers send 2-3 emails per day. 12% send a weekly email.
- 77% of marketers have seen an increase in email engagement over the last 12 months.
- Smartphone users prefer to receive brand communications via email.
- Testing your emails leads to higher ROI.
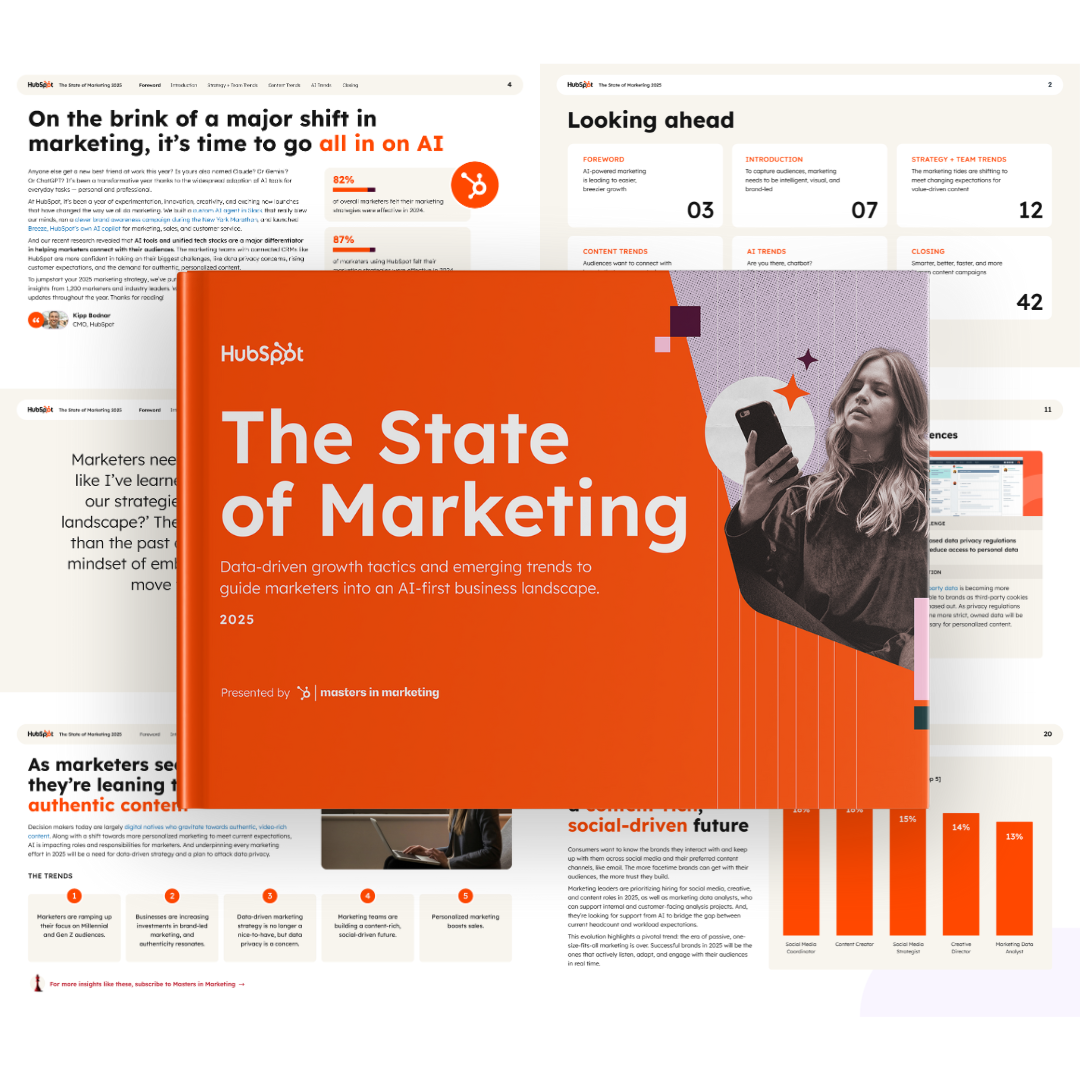
The State of Marketing in 2025
HubSpot's Annual Inbound Marketing Trends Report
- Top Marketing Channels
- AI in Marketing
- Managing Privacy
- The Future of Marketing
Download Free
All fields are required.
General Email Marketing Statistics and Best Practices
- Email marketing is used by 31% of marketers. (HubSpot Blog Research, 2023)
- Email marketing revenue is estimated to reach almost 11 billion by the end of 2023. (Statista, 2021)

- There are 4 billion daily email users. This number is expected to climb to 4.6 billion by 2025. (Statista, 2021)
- More than 347 billion emails are sent and received each day. (Statista, 2022)
- 64% of small businesses use email marketing to reach customers. (Campaign Monitor, 2021)
- 38% of brands are increasing their email budget, and just 10% are making cuts. (HubSpot Blog Research, 2023)
- The most effective strategies for email marketing campaigns are subscriber segmentation (78%), message personalization (72%), and email automation campaigns (71%). (HubSpot Blog Research, 2021)
- Emails with multimedia elements or formats with images and/or videos have the highest performance. (HubSpot Blog Research, 2023)
- The best time to send a marketing email is 9:00 AM - 12 PM EST, then 12:01 PM - 3 PM EST. The worst is 1 AM - 3 AM EST. (HubSpot Blog Research, 2023)

- 22% of marketers (or the companies they work for) send marketing emails 2-3 per day, and 21% send daily emails. 12% send a weekly email. (HubSpot Blog Research, 2022)

- Most marketers determine the frequency of their email send based on past email engagement data. (HubSpot Blog Research, 2023)
- 87% of brands say that email marketing is very critical to business success. (Litmus, 2023)
- 77% of marketers have seen an increase in email engagement over the last 12 months. (Not Another State of Marketing, 2021)
- Tuesdays are the best days to send an email for the highest performance, Sundays are the worst. (HubSpot Blog Research, 2023)

- Most marketers say Apple’s Privacy Protection feature has not impacted the accuracy of the email marketing metrics they track. Those that have reported changes say it’s had the most impact on reporting accuracy for overall email traffic. (HubSpot Blog Research, 2023)
- Personalization using dynamic content is the top personalization tactic used by email marketing teams. It’s also the best way to improve email performance. (Litmus, 2023)
- The most effective email subject lines engage curiosity, include promotional offers, and are personalized to each recipient's interests. (HubSpot Blog Research, 2021)
-
QA, A/B, and spam testing your emails leads to higher ROI. Enjoy up to a 28% higher return when you put testing to work for your email program. (Litmus, 2022)
- 85% of eCommerce marketers say their primary objective with email is increasing brand awareness. (HubSpot Blog, 2023)
Email Marketing Metric Statistics
- The top two metrics marketers track for the emails they send are clickthrough rate (34%) and open rate (31%). (HubSpot Blog Research, 2023)

- Most marketers report an average email open rate of 46-50%. (HubSpot Blog Research, 2023)
- The average email clickthrough rate is 2.6-3%. (HubSpot Blog Research, 2023)
- The average email click rate is 7-9%. (HubSpot Blog Research, 2023)
- Emails with images offer an almost 10% boost in open rates.(GetResponse, 2022)
- The average email delivery rate is 85.7% (Emai Tool Tester, 2023)
- The average email delivery rate for Google is 95%, 91% for Microsoft, 81% for Yahoo, and 76% for AOL. (Email Tool Tester, 2023)
AI Email Marketing Statistics
- 95% of marketers who use generative AI for email creation rate it “effective”, with 54% rating it “very effective.” (HubSpot's State of Generative AI, 2023)
- 43% of marketers who use generative AI say that it’s most helpful for creating emails.
(HubSpot's State of Generative AI, 2023)

- 38% of marketers who use AI use it to write emails. If you need help using AI to write emails, check out this helpful video. (HubSpot's State of Generative AI, 2023)
- 21% of Sales Professionals who use AI in their role say that it’s most useful for writing messages to prospects. 32% say it’s most useful for re-purposing messages by adapting them to a different audience. (HubSpot's State of Generative AI, 2023)
Pro tip: Want to give AI a test drive for your marketing emails? Check out Campaign Assistant, HubSpot's generative AI tool that creates customized emails in seconds.
B2B Email Marketing Statistics
- Email is the third-highest owned media platform B2B marketers used to distribute content in the past 12 months. (Content Marketing Institute, 2022)
- 81% of B2B marketers say their most used form of content marketing is email newsletters. (Content Marketing Institute, 2020)
- 14.3% of all emails go missing or have been caught by popular spam filters. (Email Tool Tester, 2023)
- B2B marketers say that new product and feature announcement marketing emails have the highest click-through rate. (HubSpot Blog Research, 2021)
- Automation is primarily used in email marketing to send triggered emails, for drip or nurture campaigns, and segmentation. (Litmus, 2021)
- B2B buyers and consumers feel overwhelmed by the volume of emails and 67% set up a junk email account to dodge unwanted emails. (Gartner, 2022)
- The biggest blockers marketers face during email production are building (41%), designing (40%), and testing (39%). (Litmus, 2023)
Mobile Marketing Statistics
- 55% of emails are opened on mobile devices. (eMarketer, 2023)
- Nearly 55% of global website traffic is generated from mobile devices, excluding tablets. (Statista, 2022)
- 46% of smartphone users prefer to receive communications from businesses via email. (Statista, 2021)
- Apple iPhone's native email app has the highest market share, followed by Gmail. (Litmus Labs, 2022)
- 35% of email marketers say they use a mobile-first or mobile responsive design process. (Litmus, 2023)
- Launching a mobile-responsive email design can increase unique mobile clicks by 15%. (MailChimp, 2021)
- 56% of marketers leverage mobile-friendly emails in their email marketing strategy. (HubSpot Blog Research, 2021)
The State of Marketing in 2025
HubSpot's Annual Inbound Marketing Trends Report
- Top Marketing Channels
- AI in Marketing
- Managing Privacy
- The Future of Marketing
Download Free
All fields are required.
B2C Email Marketing Statistics
- 87% of B2C marketers leverage automation as part of their email marketing strategy. (HubSpot Blog Research, 2021)
-
50% of people buy from marketing emails at least once per month. (Salecycle, 2022)
- Your audience will reward you with higher open and click rates if you don’t send more than five newsletters a week. (GetResponse, 2020)
- 60% of retail, e-commerce, and consumer goods and services companies are personalizing emails based on past purchases, versus 38% in 2019. (Litmus, 2020)
- More than 8 out of 10 people will open a welcome email, generating 4x as many opens and 10x as many clicks as other email types. (GetResponse, 2020)
- 4 out of 5 marketers personalize emails with profile data and 64% personalize them by segment. (Constant Contact, 2023)
- More than 8 out of 10 people will open a welcome email, generating 4x as many opens and 10x as many clicks as other email types. (GetResponse, 2020)
- Abandoned cart emails convert 3x more than other automated emails. (Email Tool Tester, 2023)
- Nearly 21% of all email campaigns are opened within the first hour of sending. (GetResponse, 2023)
- 60% of respondents say that marketing emails have influenced their purchases. (Constant Contact, 2023)
- 64% of B2C marketers consider accessibility when creating their emails. (Pathwire, 2021)
Email Marketing Demographics
- 99% of email users check their inbox every day, with some checking 20 times a day. Of those people, 58% of consumers check their email first thing in the morning. (OptinMonster, 2020) 84.3% of consumers say they check their emails at least once a day. (Pathwire, 2021)

- 37% of survey respondents in the U.S. have two email addresses and 28% have over four. (Statista, 2022)
- Consumers spend an average of 9 seconds reading brand emails. (Statista, 2022)
- A majority of Americans say the emails they receive are not useful (59%). (Edisonmail, 2023)
- Too many emails is the number one trigger for consumers to unsubscribe. (Gartner, 2022)
- Consumers prefer to receive emails from their favorite brands just a few times per month. (Gartner, 2022)
- When it comes to data security, 32% of consumers are distrustful when it comes to giving companies their email. (HubSpot, 2023)
- Email is the leading way consumers in the U.S. discover coupons from brands. (Statista, 2021)
- Consumers say they’re most likely to open emails about available promotions/discounts. (Digital Commerce 360, 2022)
- Consumers also like emails that mention a birthday or anniversary (54%) and share local/regional events and offers (53%). (Gartner, 2022)

- 59% of Millennials primarily use their smartphone to check email, while 67% of Generation Z scans their inbox on mobile. (Bluecore, 2021)
- Gen Z, Millennials, and Gen X most often use email for online shopping. Boomers use email for correspondence with friends and family. (Edisonmail, 2023)
- The most significant steps marketers take to champion accessibility when creating their emails is writing short, descriptive subject lines, making links and buttons easy to see, and keeping paragraphs short and simple. (Pathwire, 2021)
Apply Your Email Knowledge
Many of the data points will help you make the case for investing more time and money into your email marketing strategy. While you can refer back to this post at any time, you can also start applying them to your next campaign.
Editor's Note: This blog post was originally published in March 2019, but was updated for comprehensiveness and freshness.


![How to Write a Marketing Email: 28 Tips for Writing Compelling Email Copy [+ HubSpotter Insights]](https://53.fs1.hubspotusercontent-na1.net/hubfs/53/Untitled%20design%20(40).jpg)

![Professional Email Address: How to Create One [+ Examples]](https://53.fs1.hubspotusercontent-na1.net/hubfs/53/professional-email-address-2.jpg)