.png?width=112&height=112&name=Image%20Hackathon%20%E2%80%93%20Vertical%20(85).png)
Research shows that existing customers spend 67% more than new customers, and acquiring a new customer can cost 5 to 25 times more than retaining one. That’s why businesses turn to retention metrics to understand, analyze, and strengthen the processes that keep customers engaged and loyal over time.
This guide breaks down the most essential retention metrics, why they matter, and how to measure and benchmark them against industry standards. It also highlights how platforms like HubSpot’s CRM and HubSpot Service Hub can centralize and automate retention tracking for more accurate, real-time insights.
Table of Contents
- What are customer retention metrics?
- How to Measure Customer Retention
- Customer Retention Metrics
- How to Track and Use Customer Retention Metrics
- Frequently Asked Questions About Customer Retention Metrics
.png)
Free Customer Service Metrics Calculator
Calculate your business's key metrics and KPIs for customer support, service, and success with this free template.
- Customer Acquisition Cost
- Customer Lifetime Value
- Customer Satisfaction Score
- And More!
Download Free
All fields are required.
Form not available
What are customer retention metrics?
Retention metrics are key indicators of how well a business retains customers over time. The most important metrics include customer retention rate, churn rate, repeat purchase ratio, and customer lifetime value.
Measuring retention involves selecting appropriate metrics for the business model, applying clear formulas, and comparing results to industry benchmarks. For instance, SaaS companies often target a 90–95% monthly retention rate, whereas ecommerce benchmarks may vary.
Monitoring these metrics in a dashboard helps identify trends and guide decision-making that increases retention. Tools such as HubSpot’s CRM and Service Hub simplify tracking these metrics through automation and help translate the insights into real business growth. HubSpot CRM enables automated tracking and analysis of retention metrics.
Ready to start crunching retention metrics? Check out HubSpot’s Customer Service Metrics Calculator.
Why are customer retention metrics important?
Retention metrics offer direct insight into the customer experience. A high retention rate (or low churn rate) indicates that customers are satisfied and deriving value from a product or service. These satisfied customers are likely to refer others, which can significantly boost a business’s bottom line. On the contrary, poor retention metrics are a warning light that something needs attention. It could be friction in the customer journey, inadequate customer support, or gaps in product-market fit. Regardless, customer retention metrics highlight areas of the business that need improvement.
Beyond customer satisfaction, retention metrics directly impact profitability. Retaining customers is significantly more cost-effective than acquiring new ones, and honing in on retention metrics can boost recurring revenue by guiding businesses towards strategies to keep customers happy and transform churn risks into loyal advocates.
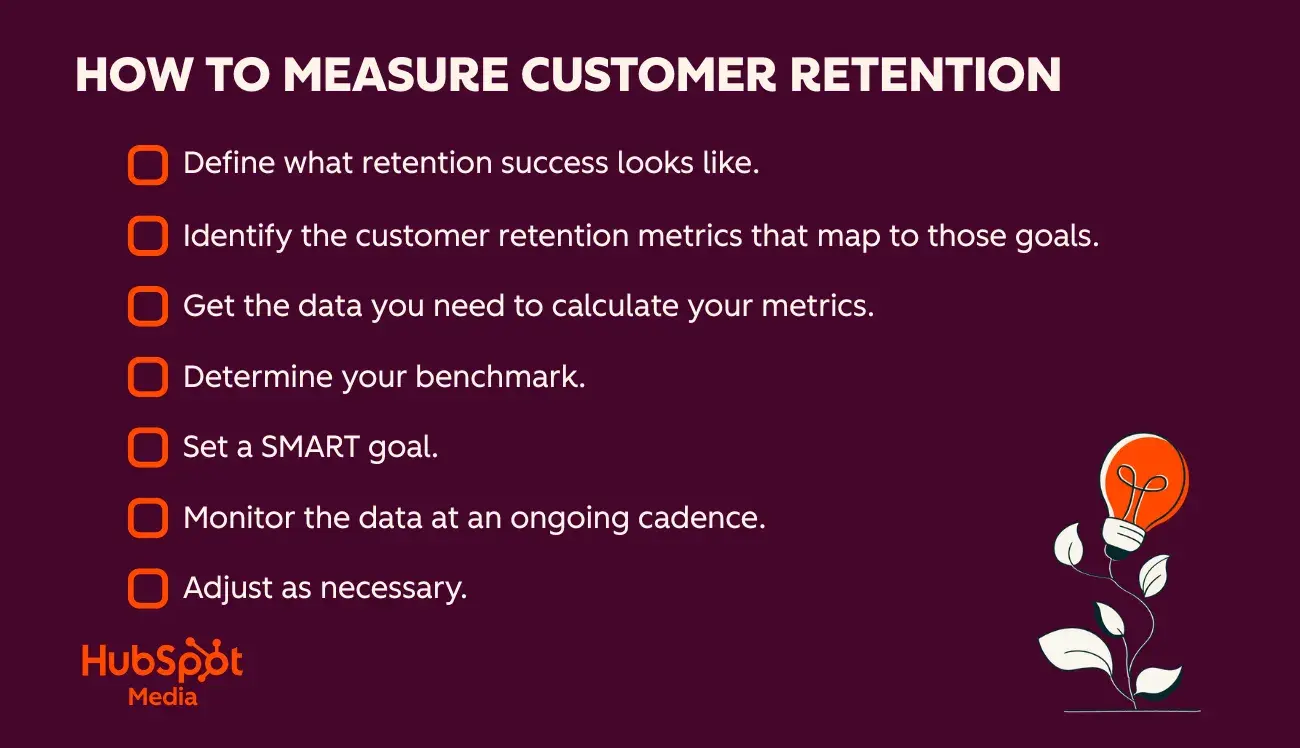
How to Measure Customer Retention
- Define what retention success looks like.
- Identify the customer retention metrics that map to those goals.
- Get the data you need to calculate your metrics.
- Determine your benchmark.
- Set a SMART goal.
- Monitor the data at an ongoing cadence.
- Adjust as necessary.
1. Define what retention success looks like.
Every business model has a different definition of retention success, so organizations must begin by clarifying what long-term customer loyalty and engagement look like in their specific context.
Success may involve maintaining a certain percentage of customers over 12 months, reducing monthly churn below a predefined threshold, or achieving a steady volume of repeat purchases.
To begin measuring customer retention, business leaders must understand which metrics are relevant in their industry, research key benchmarks, determine which customer behaviors matter most, and decide how they want to influence them.
2. Identify the customer retention metrics that map to those goals.
After defining what retention success looks like, the next step is determining which metrics best capture progress toward the goal. Below are the most common retention metrics that many businesses choose to prioritize:
- Customer retention rate, or the percentage of customers who remain active over a period.
- Churn rate, or the percentage of customers who stop using the product or service over a period.
- Repeat purchase ratio, or the percentage of customers who buy again within a set time frame.
- Customer lifetime value, or the projected revenue from a customer over their entire lifetime with a business.
Retention benchmarks vary widely by industry. For example, SaaS businesses thrive on monthly recurring revenue, so the monthly churn rate is always top of mind. For SaaS, 3%–5% is considered a solid churn rate, while less than 1% marks world-class retention success. Meanwhile, ecommerce and retail organizations are more concerned with repeat purchase rate (RPR), which measures the percentage of customers who return to purchase within a year. For those businesses, 25%–30% is the benchmark.
Selecting metrics that align with retention goals is key to developing a strategy to keep customers loyal.
3. Get the data you need to calculate your metrics.
Once the necessary metrics are identified, teams must pull the required information from their data sources. CRM tools make it easy to gather the data needed to calculate retention metrics.
For example, to calculate customer retention rate, the formula calls for the following customer data points:
- Number of customers at the beginning of the period.
- Number of customers acquired during the period.
- Number of customers at the end of the period.
4. Determine your benchmark.
A benchmark is a standard or point of reference against which performance can be measured. Knowing key benchmarks is crucial because they indicate where a business stands relative to previous data and whether it is improving or falling behind.
Pro tip: Business leaders should examine industry customer retention benchmarks alongside historical data from their own businesses.
5. Set a SMART goal.
With your benchmark in mind, it’s time to set a SMART goal. SMART goals are more than just a number to hit. They illuminate criteria that influence project management and employee performance expectations.
The acronym SMART stands for:
- Specific. Make your goal narrow.
- Measurable. Define how to track and prove progress.
- Attainable. Ensure the goal is realistic for the period.
- Relevant. Align the goal with company values or purpose.
- Time-based. Assign an end date to prioritize the goal.
SMART goals are attainable and include a clear path to success. For an organization with an 85% monthly retention rate, a SMART goal might be to increase it to 90%.
Pro tip: Avoid setting generic customer retention goals. Instead, set specific targets using industry and historical data, and examine multiple customer segments and cohorts. For example, focus a SMART goal specifically on improving retention rate by a defined amount for customers within the first 90 days.
Free Customer Service Metrics Calculator
Calculate your business's key metrics and KPIs for customer support, service, and success with this free template.
- Customer Acquisition Cost
- Customer Lifetime Value
- Customer Satisfaction Score
- And More!
Download Free
All fields are required.
Form not available
6. Monitor the data at an ongoing cadence.
Keeping track of customer retention metrics requires systematic data monitoring and analysis. Based on SMART goals and customer retention benchmarks, business leaders should determine how often to pull necessary data.
High-volume businesses like SaaS should measure retention monthly or even weekly. However, companies with long-term contracts may only need to track these metrics quarterly. Sentiment metrics like NPS should be monitored continuously.
Pro tip: Use metrics together to predict growth. For example, a drop in NPS may be correlated with a spike in churn rate. Analyzing these metrics together can predict revenue loss before it happens, giving businesses a chance to act.
7. Adjust as necessary.
Whether the goal is reached or missed, the work doesn’t stop there. Teams should continually adjust goals and refine data as the business scales and customer expectations evolve.
Pro tip: When adjusting strategy, don’t rely on the numbers alone. If retention drops, layer qualitative data on top of quantitative metrics. Leaders should review exit surveys, read support tickets, or interview churned customers to understand why customers are leaving.
Customer Retention Metrics
- Customer Retention Rate
- Customer Churn
- Revenue Churn
- Existing Customer Growth Rate
- Repeat Purchase Ratio
- Product Return Rate
- Days Sales Outstanding
- Net Promoter Score (NPS)
- Time Between Purchases
- Loyal Customer Rate
- Customer Lifetime Value

Calculating this data can be time-consuming, but HubSpot’s retention metrics calculator makes it a breeze:
Featured Resource: Customer Retention Metrics Calculator Download for Free
HubSpot created the Customer Service Metrics Calculator to save time and simplify the calculation of business customer retention metrics. Users only need to input their business data to instantly see customer retention rates, revenue churn, customer lifetime value, and other key metrics. Monitoring these over time reveals trends and improvements in retention.
While there are countless data points available, most organizations focus on a few core metrics. Below are the 11 most critical retention metrics to track: customer retention rate, customer churn, revenue churn rate, existing customer revenue growth rate, repeat purchase ratio, product return rate, days sales outstanding, Net Promoter Score, time between purchases, loyal customer rate, and customer lifetime value.
1. Customer Retention Rate
Measures: The percentage of customers a business keeps over a set period.
%20%20customers%20at%20start%20of%20period.webp?width=650&height=374&name=customer%20retention%20metrics%2c%20customer%20retention%20formula%20(total%20number%20of%20customers%20at%20the%20end%20of%20the%20period%20%E2%80%93%20new%20customers%20acquired)%20%20customers%20at%20start%20of%20period.webp)
The most straightforward formula is the customer retention rate. Customer retention rate measures the percentage of customers a business keeps over a set period. Companies need to understand how many of their existing customers remain loyal over time to determine whether the current strategy is effective. After all, 65% of a company’s revenue comes from existing customers on average.
How to Calculate Customer Retention
Calculating customer retention rate requires the following data:
- The number of customers at the end of a period (E).
- The number of customers added within the period (N).
- The number of customers at the start of a period (S).
Teams determine the customer retention rate by subtracting the number of new customers acquired during a period (N) from the number of customers at the end of the period (E), then dividing the result by the number of customers at the beginning of the period (S).
Retention Rate Formula: Customer Retention Rate = [(E – N) / S] x 100
For example, if a business has 500 customers at the start (S), 530 customers at the end (E), and 80 new customers acquired (N), the retention rate is calculated as follows:
530 – 80 = 450
↓
450 ÷ 500 = .9
↓
.9 x 100 = 90% retention rate
Why it matters: Retention metrics help businesses identify at-risk customers and drive revenue growth. This metric provides a high-level “health check” of the business and is a good indicator of product-market fit for established companies.
What is a good retention rate?
A “good” client retention rate varies widely and depends entirely on a business’s industry, pricing model, and customer base. There is no universal retention rate target, so organizations should instead focus on comparing their retention rates with industry peers and their own historical data.
In general, high retention is associated with a strong product-market fit and high levels of customer satisfaction and loyalty. Meanwhile, low retention indicates friction in the customer experience, competitive pressure, or a misalignment between the product’s value and customer expectations. Industry benchmarks provide context for interpreting retention metrics.
Below is a collection of average retention rates by industry:
|
Industry |
Average Retention Rate |
|
SaaS (Enterprise) |
90–95% |
|
SaaS (SMB) |
70–80% |
|
Ecommerce |
30–40% |
|
Banking |
75% |
|
Telecommunications |
78–85% |
|
Retail |
63% |
|
Hospitality, Travel, Restaurants |
55% |
|
Insurance |
83% |
|
Media (streaming) |
84% |
Retention Rate vs. Churn Rate
Retention rate and churn rate are closely related but measure opposite outcomes. Together, they provide a complete picture of customer loyalty and loss.
In fact, churn rate is inversely related to retention rate: If one goes up, the other must go down. Assuming the calculation uses the same customer base and time period, retention rate and churn rate add up to 100%.
Retention Rate: Percentage of customers an organization keeps over a period.
Churn Rate: Percentage of customers an organization loses during the same timeframe.
Retention rate and churn rate both examine customer retention, but through different lenses.
Retention rate is a positive metric that tells the story of how many customers love a product and are loyal towards a business. Teams use retention rate targets to justify investments in onboarding, support, new features, and other customer-focused programs.
Meanwhile, churn rate is a negative metric that acts as a warning light. It forces teams to focus on failure points and identify problems and areas of friction in the customer experience.
However, not all churned customers leave due to a poor experience. Some leave unintentionally. There are two types of customer churn.
Voluntary Churn: The customer consciously decides to stop using a service. Potential reasons include:
- Lack of perceived value.
- Poor onboarding or engagement.
- Pricing concerns or finding a cheaper competitor.
- Switching to a competing product.
- Outgrowing the need for the service.
Businesses must address voluntary churn by improving the product, service, or customer experience, and by ensuring pricing is competitive.
Involuntary Churn: The customer leaves due to a payment failure they did not intend. Potential culprits are:
- Expired credit or debit cards.
- Insufficient funds.
- Outdated billing information.
- Declined transactions.
- Fraud holds.
Involuntary churn can be mitigated by improving internal systems that manage payments and alert customers to failed payments, enabling customers to update their information easily.
2. Customer Churn
Measures: The rate at which customers stop doing business with an organization.
%20%20number%20of%20customers%20at%20start%20of%20year.webp?width=650&height=374&name=customer%20retention%20metrics%2c%20customer%20churn%20rate%20formula%20(number%20of%20customers%20at%20start%20of%20year%20%E2%80%93%20number%20of%20customers%20at%20end%20of%20year)%20%20number%20of%20customers%20at%20start%20of%20year.webp)
Customer churn refers to the loss of customers over a defined period. While customer attrition is natural, a persistently high annual churn rate typically signals a failure to meet customer expectations or goals.
How to Calculate Customer Churn
Customer churn rate is calculated by subtracting the number of customers at the start of a period from the number at the end (to determine total customers lost), then dividing by the number at the beginning. Multiplying that number by 100 yields a percentage.
Churn Rate Formula
Annual Churn Rate = [(Number of Customers at Start of Year – Number of Customers at End of Year) / Number of Customers at Start of Year] x 100
Example of Churn Rate Formula
If a company starts the year with 100 customers and ends the year with 80 customers, the churn rate calculation is as follows:
100 – 80 = 20 customers lost
↓
20 ÷ 100 = .2
↓
.2 x 100 = 20% annual customer churn
In this example, 20% annual customer churn may be cause for alarm, depending on the industry. For SaaS companies, a churn rate of 8% or lower is a strong indicator of sustainable growth. Meanwhile, churn rates up to 25% are considered normal for finance/credit and retail companies.
Why it matters: A high customer churn rate indicates poor customer experience. It’s like a check engine light alerting businesses to look under the hood and investigate where and why customer needs and expectations are unmet.
3. Revenue Churn Rate
Measures: The rate at which revenue is lost from the existing customer base.
![customer retention metrics, monthly revenue churn rate = {[(mrr at start of month – mrr at end of month) – mrr in upgrades during month] mrr at start of month} x 100](https://53.fs1.hubspotusercontent-na1.net/hub/53/hubfs/customer%20retention%20metrics%2c%20monthly%20revenue%20churn%20rate%20=%20%7B%5B(mrr%20at%20start%20of%20month%20%E2%80%93%20mrr%20at%20end%20of%20month)%20%E2%80%93%20mrr%20in%20upgrades%20during%20month%5D%20%20mrr%20at%20start%20of%20month%7D%20x%20100.webp?width=650&height=374&name=customer%20retention%20metrics%2c%20monthly%20revenue%20churn%20rate%20=%20%7B%5B(mrr%20at%20start%20of%20month%20%E2%80%93%20mrr%20at%20end%20of%20month)%20%E2%80%93%20mrr%20in%20upgrades%20during%20month%5D%20%20mrr%20at%20start%20of%20month%7D%20x%20100.webp)
Revenue churn accounts for revenue losses from plan downgrades, cancellations, or customer churn. This is often a more critical indicator than customer churn alone, as losing one high-value client can impact the bottom line more than losing several low-value ones. It is an especially critical metric for SaaS and subscription-based companies.
While the overall revenue churn rate offers a high-level view of customer health, monitoring individual customer account changes is essential. The primary goal of customer success teams is to proactively address issues that could lead to subscription downgrades or cancellations.
When revenue churn occurs, it may signal an imminent customer departure, requiring swift action from operations or services teams to prevent it.
Free Customer Service Metrics Calculator
Calculate your business's key metrics and KPIs for customer support, service, and success with this free template.
- Customer Acquisition Cost
- Customer Lifetime Value
- Customer Satisfaction Score
- And More!
Download Free
All fields are required.
Form not available
How to Calculate Revenue Churn Rate
Revenue churn is calculated by subtracting the monthly recurring revenue (MRR) at the end of the month from the MRR at the beginning of the month. Next, subtract any revenue accrued from upselling or cross-selling to existing customers (upgrades). Finally, this number is divided by the MRR at the beginning of the month, and then multiplied by 100 to yield a percentage.
Revenue Churn Rate Formula
Monthly Revenue Churn Rate = {[(MRR at Start of Month – MRR at End of Month) – MRR in Upgrades during Month] / MRR at Start of Month} x 100
Example of Revenue Churn Rate

In this example, the company began September with an MRR of $50,000. During that month, $5,000 was lost to churn (making MRR at the end of the month $45,000), and $2,500 was gained from upgrades.
The revenue churn rate for September is calculated as follows:
$50,000 – $45,000 = $5,000 MRR lost
↓
$5,000 – $2,500 from upgrades = $2,500 net loss
↓
($2,500 ÷ $50,000) x 100 = 5% revenue churn rate
Why it matters: Revenue churn provides greater insight into how customer churn affects the bottom line, especially for businesses with tiered pricing models.
4. Existing Customer Revenue Growth Rate
Measures: The rate at which the business generates increased revenue from its existing customer base.
%20%20mrr%20at%20start%20of%20month.webp?width=650&height=374&name=user%20retention%20metrics%2c%20monthly%20revenue%20growth%20formula%20(mrr%20at%20end%20of%20month%20%E2%80%93%20mrr%20at%20start%20of%20month)%20%20mrr%20at%20start%20of%20month.webp)
Monthly revenue growth (sometimes called expansion revenue) quantifies revenue growth from existing customers driven by increased spending from upsells, cross-sells, and upgrades.
Customer retention is crucial because existing customers are significantly more profitable than new ones. To put that in perspective, a 5% increase in customer retention can boost profits by 25% to 95% for most businesses.
How to Calculate Existing Customer Revenue Growth Rate
This measurement focuses exclusively on existing customer revenue (no new sales are included).
Customer Revenue Growth Rate Formula
Monthly Revenue Growth Rate = [(MRR at the End of Month – MRR at the Start of Month) / MRR at the Start of Month] x 100
Example of Customer Revenue Growth Rate
Let’s calculate the revenue growth rate for September using the same numbers as above.

The business started in September with an MRR of $50K and lost $5K to churn, leaving them with $ 45K in MRR at the end of the month.
$50,000 – $45,000 = $5,000 MRR lost
↓
$5,000 ÷ $50,000 = .1 x 100 = 10%
↓
Since this is a revenue loss, it’s represented as -10% revenue churn.
Pro tip: Since this calculation does not take into account the new MRR from new customers, it’s considered Gross revenue churn.
5. Repeat Purchase Ratio
Measures: The percentage of customers who return for a subsequent purchase.
Repeat purchase ratio (RPR) is a strong indicator of customer loyalty, particularly for ecommerce and retail businesses. Marketing teams use RPR to assess the performance of strategies aimed at driving second or third transactions within a set timeframe.
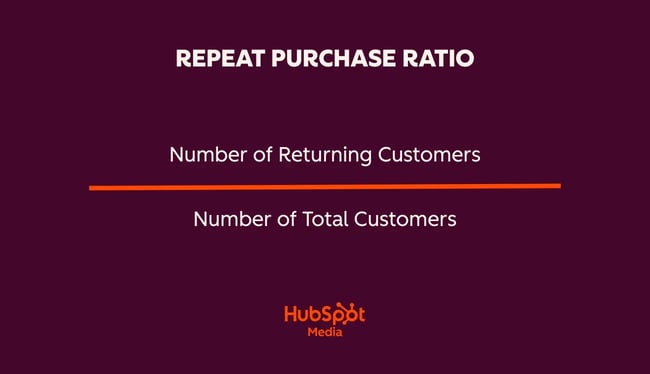
How to Calculate Repeat Purchase Ratio
Calculating the repeat purchase rate is simple. The ratio is determined by dividing the number of returning customers by the total number of customers.
Repeat Purchase Ratio Formula
Repeat Purchase Ratio = Number of Returning Customers / Number of Total Customers
For example, if a company has 100 total customers, and 80 of them return to make repeat purchases, the repeat purchase ratio is:
(80 ÷ 100) = .8
↓
.8 x 100 = 80% repeat purchase ratio
Pro tip: Repeat purchase ratio is essential for ecommerce and retail because it directly reflects customer loyalty.
6. Product Return Rate
Measures: The percentage of total units sold that are returned to the business.
Product return rate only applies to companies selling tangible goods. It reflects product quality, alignment with customer needs and expectations, and overall customer satisfaction.
The average return rate is 24.5% for ecommerce companies and 8.71% for in-store purchases.
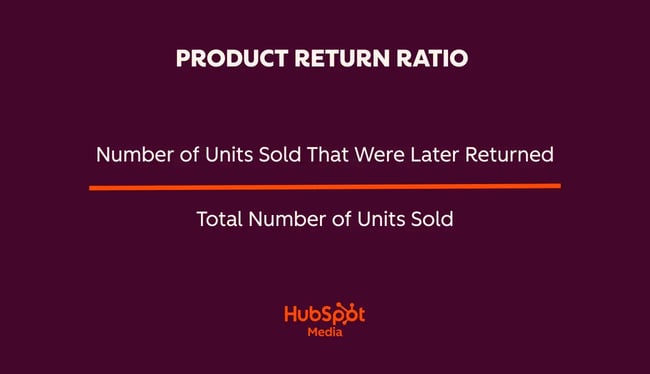
Product Return Rate Formula
Product Return Rate = Number of Units Returned / Total Number of Units Sold
Example of Product Return Rate
If a business sells 1,000 units of a product and 70 are returned, the product return rate is:
(70 ÷ 1,000) × 100 = 7%
For a brick-and-mortar establishment, that’s a solid number.
Why it matters: High return rates signal friction in the customer experience. It could be misaligned expectations, unclear product descriptions, sizing issues, packaging problems, or any number of factors that prevent the customer from deriving value from the product. Regardless, a high return rate is a canary in the coal mine for businesses to take a closer look at their products or the messaging surrounding them.
Pro tip: HubSpot’s Service Analytics can help you track, analyze, and visualize all these important customer retention metrics.
7. Days Sales Outstanding
Measures: The average number of days required to collect payment from a sale.
%20%20365%20days.webp?width=650&height=374&name=customer%20retention%20metrics%2c%20days%20sales%20outstanding%20formula%2c%20(accounts%20receivable%20%20annual%20revenue)%20%20365%20days.webp)
Days sales outstanding (DSO) is the average number of days it takes for an organization to collect payment after a sale. Although this is traditionally more of an accounting/finance metric, it also has implications for customer success and retention. If DSO is high, it may indicate customers are frustrated and reluctant to pay their bill, a potential churn indicator, or perhaps there is friction in the payment flow, which also affects satisfaction.
How to Calculate Days Sales Outstanding
DSO is typically calculated for all outstanding invoices a company has at a given time, rather than for individual invoices. It can be determined monthly, quarterly, or yearly by dividing the accounts receivable during the period by the total credit sales in the same period, then multiplying by the number of days in that timeframe. The figure shows the average number of days required to collect an invoice.
For simplicity, an annual DSO formula is provided below.
Days Sales Outstanding Formula
Annual DSO = (Accounts Receivable ÷ Total Credit Sales) × 365
Example of Days Sales Outstanding
If a company generates $100,000 in sales and $75,000 has been collected, the annual DSO would be 274 days, calculated as:
($75,000 ÷ $100,000) x 365 days = 274 annual DSO
Why it matters: DSO uncovers hidden retention risks and friction in the customer experience that other metrics don’t reveal. DSO issues indicate the need for streamlined billing processes or more transparent communication.
8. Net Promoter Score® (NPS)
Measures: The likelihood that customers will recommend a product or service to others.

Net Promoter Score (NPS) quantitatively measures customers’ overall sentiment towards a brand. It’s based on a single survey question that asks customers, on a scale from 0 to 10, how likely they are to recommend a product or service to others. NPS is widely considered a clear indicator of loyalty, customer satisfaction, and long-term retention.
How to Calculate Net Promoter Score
Calculating NPS score requires first categorizing respondents based on their response to the ubiquitous question:
“On a scale of 0-10, how likely are you to recommend [company/product] to a friend or colleague?”
Promoters (9-10): Loyal customers who will actively spread the word about a business through word-of-mouth.
Passives (7-8): Satisfied customers who are yet to be converted to brand ambassadors. They are unlikely to say anything negative about a business, but they are susceptible to competition.
Detractors (0-6): Unhappy customers who are likely to damage a brand through negative reviews, word-of-mouth, and churn.
Net Promoter Score Formula
Net Promoter Score = % of Promoters – % of Detractors
Example of Net Promoter Score
If 60% of respondents are Promoters and 20% are Detractors, the resulting NPS is:
60 – 20 = 40 NPS score
What it matters: NPS is one of the strongest early warning signs of retention health. It helps teams uncover the specific drivers behind churn and identify opportunities to improve the customer journey.
9. Time Between Purchases
Measures: The average time customers take to buy from you again.
Time between purchases indicates how quickly customers return to buy again, serving as a crucial metric for understanding customer satisfaction. A short gap between purchases can indicate high levels of satisfaction and engagement. In contrast, a lengthy gap might signal fading interest, friction in the buying experience, or a product that isn’t delivering expected value to customers.
How to Calculate Time Between Purchases
Calculating the average time between purchases requires a CRM that can track purchase dates for individual customers.
Determine the individual purchase time interval for each customer, add them all together, and divide by the total number of repeat customers.
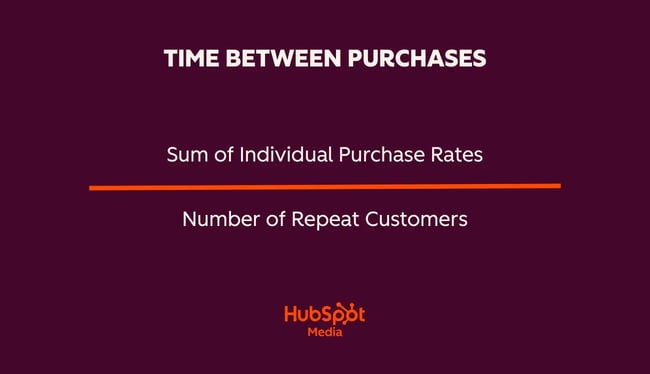
Time Between Purchases Formula
Time Between Purchases = Sum of Individual Purchase Rates / Number of Repeat Customers
Example of Time Between Purchases

The data above shows the average purchase rate in days for five customers. Adding these numbers yields a total purchase rate of 40 days.
40 days ÷ 5 total customers = 8 days average time between purchases
Why it matters: Time between purchases provides insight into customer engagement, helps predict purchasing behavior, and informs marketing strategies.
10. Loyal Customer Rate
Measures: The number of customers who make repeat purchases over a period.

The loyal customer rate helps to identify the portion of a customer base that demonstrates strong, ongoing customer loyalty. Loyal customers generate around 65% of a company’s total revenue, making them a crucial segment of any business’s base. Understanding the loyal customer rate is essential for forecasting, reducing acquisition costs, and increasing revenue, since loyal customers spend more than new customers and are likely to generate referrals.
How to Calculate Loyal Customer Rate
Most organizations define loyal customers as those who make frequent purchases (three or more in a year), renew subscriptions consistently, or consistently engage with a product. The criteria for defining a loyal customer vary by business.
Once customer loyalty has been defined, calculating the loyal customer rate is as simple as dividing the number of loyal customers by the total number of customers.
Loyal Customer Rate Formula
Loyal Customer Rate = Number of Repeat Customers / Total Customers
Example of Loyal Customer Rate
If a company has 2,000 total customers, and 400 of them met the criteria for loyalty, their loyal customer rate is:
400 ÷ 2,000 = .2
↓
.2 x 100 = 20% loyal customer rate
Why it matters: Loyal customer rate highlights the most valuable portion of any business’s customer base. Tracking this metric provides insights into whether retention strategies are working and into how customer engagement improves over time.
11. Customer Lifetime Value
Measures: The total projected revenue generated by a single customer over their entire relationship with a business.
Customer lifetime value (CLV) is a predictive metric that informs strategy throughout an organization. Tracking CLV contextualizes and justifies acquisition costs, and reflects long-term engagement, purchasing behavior, and the overall value of retaining customers over time.
How to Calculate Lifetime Value
To calculate customer lifetime value, follow these steps:
- Calculate average annual customer revenue. Divide total gross annual sales by the number of unique customers in a year. This is the average yearly revenue expected from a single customer.
- Determine average customer lifespan. Establish the average length of time (in years) a customer typically remains with the business.
- Compute CLV. Multiply the Average Annual Customer Revenue by the Average Customer Lifespan.
Free Customer Service Metrics Calculator
Calculate your business's key metrics and KPIs for customer support, service, and success with this free template.
- Customer Acquisition Cost
- Customer Lifetime Value
- Customer Satisfaction Score
- And More!
Download Free
All fields are required.
Form not available
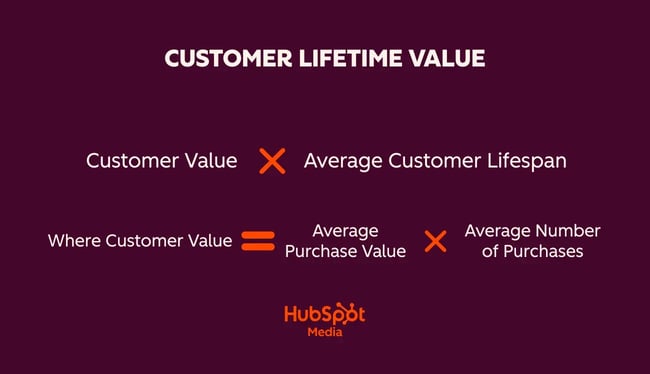
Customer Lifetime Value Formula
Customer Lifetime Value = Customer Value * Average Customer Lifespan
where Customer Value = Average Purchase Value * Average Number of Purchases
Example of Customer Lifetime Value
A SaaS company, which bills its 2,000 customers annually, generated $5 million in revenue last year. This equates to an average annual revenue of $2,500 per customer ($5,000,000 ÷ 2,000 customers).
At this company, a customer typically stays with the software company for 4.5 years.
Based on these figures, CLV is calculated as follows:
$2,500 (average customer value) x 4.5 years (average customer lifespan) = $11,250 CLV
Why it matters: CLV helps teams allocate resources effectively and create projections for the future. Greater CLV can justify higher investments in other business areas, such as acquisition and customer support. Low CLV indicates retention and satisfaction issues, signaling that a customer journey analysis is necessary.
How to Track and Use Customer Retention Metrics
![]()
Tracking retention metrics requires the right tools. HubSpot’s CRM, Service Hub, and Service Analytics Suite enable the creation of dashboards that visualize customer retention metrics in real time. The following steps outline how organizations can track key retention metrics and turn those insights into action.
1. Choose the retention metrics to monitor.
With so many customer retention metrics available, choosing the right ones to focus on depends on an organization’s business model and retention goals.
- Subscription and SaaS organizations: Customer retention rate, churn rate, net revenue retention, customer lifetime value, NPS.
- Ecommerce and retail teams: Repeat purchase ratio, time between purchases, product return rate.
- Service and support organizations: CSAT, NPS, ticket volume, time to close, customer wait time.
Selecting a focused set of metrics is the first step toward transforming insights into tangible improvements to the customer experience.
2. Navigate to Service Analytics suite.
In HubSpot Service Hub, teams can access prebuilt analytics explicitly designed for retention, customer satisfaction, and support efficiency.
In HubSpot Service Hub:
- Navigate to Reporting > Reports.
- Select Service in the left sidebar menu to open Service Analytics.
Once in the Service Analytics suite, select one of the many pre-made service analytics reports, including customer retention-related reports such as CSAT, NPS, and Support Volume, all of which affect customer retention.
3. Select a pre-built retention report.
In the Service Analytics suite, analysts can choose a retention report in two ways:
- Under Quick Answers, select a question related to customer satisfaction or support volume (e.g., “How many tickets get created by category?”).
- In the left-side panel, click a topic area, such as Customer Satisfaction (to find NPS and CSAT scores) or Team Performance (to find support volume and customer wait time, which are correlated with churn).
4. Customize report properties and dimensions.
Once a report is selected, teams can customize it to focus specifically on retention metrics.
Above the report, utilize the available filters. For more advanced control, expand the right side panel and use the Settings tab.
- Property: Select the key data to be measured (e.g., Ticket Status for churn tracking).
- Dimension: Choose how the data is grouped (e.g., group by customer lifecycle stage or region).
- Frequency: Set the reporting period (daily, weekly, monthly, etc.) to monitor trends over time.
5. Save the report to a dedicated dashboard.
After customizing a report:
- Click Save report.
- Add it to an existing retention dashboard or create a new one.
A dedicated “Customer Retention Dashboard” might include:
- Retention rate
- Churn rate
- Customer lifetime value
- NPS and CSAT
- Ticket volume and time to close
- Customer wait time
Centralizing these metrics gives leadership teams a unified view of customer health.
6. Analyze and strategize for growth.
The most critical step is turning dashboard insights into an actionable strategy. Teams should routinely analyze the dashboard to identify friction points and opportunities to streamline the customer experience. Examples of insights include:
- Proactive intervention. If a report shows a drop in NPS, account teams can proactively intervene before it leads to churn.
- Friction detection. High ticket volume paired with low CSAT may point to onboarding or product issues.
- Revenue forecasting. Rising CLV indicates stronger long-term loyalty, which positively informs investment decisions.
- Customer experience mapping. Increases in customer wait time often correlate with lower retention.
Using the data in HubSpot’s Service Hub, teams can proactively stabilize at-risk relationships and pinpoint opportunities to improve customer retention.
Frequently Asked Questions About Customer Retention Metrics
What is a retention metric?
A retention metric is a measurement that shows how effectively a business keeps customers over time. Key metrics include: customer retention rate, churn rate, repeat purchase ratio, and customer lifetime value. Analyzing these metrics reveals how satisfied customers are throughout their journey and how likely they are to continue engaging with a product or service. Retention metrics help organizations identify at-risk customers and uncover opportunities to strengthen loyalty.
How do I calculate customer retention rate?
Customer retention rate is calculated using the formula:
[(Customers at end of period – New customers acquired) ÷ Customers at start of period] × 100.
This calculation isolates retained customers by excluding new ones, providing a clear view of how well an organization preserved its existing customer base over the selected timeframe.
What’s the difference between retention rate and churn rate?
Retention rate measures the percentage of customers a business keeps, while churn rate measures the percentage that leaves. When measured over the same period using the same customer base, the two metrics are inversely related and sum to 100%. Retention rate reflects customer loyalty and satisfaction, whereas churn rate highlights dissatisfaction, friction, or unmet expectations. Both metrics are essential for evaluating overall customer health.
What is a good customer retention rate?
A good retention rate depends on industry and business model. SaaS companies typically aim for 90–95% monthly retention, with top performers breaking 97%. Ecommerce businesses often consider 20–30% annual repeat purchase rates a strong indicator of loyalty. Because benchmarks vary, businesses should compare user retention metrics against industry benchmarks and their own historical data.
How often should I measure retention metrics?
Retention metrics benefit from consistent review across different time frames. Support-related metrics such as churn rate, support volume, and customer wait time are often monitored monthly, while sentiment indicators like NPS and CSAT are commonly reviewed quarterly. Long-term metrics such as customer lifetime value are typically evaluated annually.
What’s the difference between customer retention metrics and employee retention metrics?
Customer retention tracks whether buyers continue purchasing from a business, measuring repeat business, churn rate, and lifetime value. Employee retention tracks whether staff stay with a company, measuring turnover, tenure, and workforce stability.
What are the three Rs of employee retention, and do they apply to customer retention?
The traditional three Rs of employee retention are Respect, Recognition, and Rewards. These Rs also apply to customers. Both audiences want to feel valued, appreciated, and fairly compensated for their commitment. Here’s what each R looks like for customers:
- Respect. Valuing customers’ time, preferences, and feedback.
- Recognition. Acknowledging loyalty, milestones, or VIP status.
- Rewards. Loyalty programs, exclusive perks, or special offers.
Which retention metric is most important?
The most crucial retention metric varies by business model. Subscription and SaaS organizations often prioritize churn rate and net revenue retention because they directly affect recurring revenue, while ecommerce businesses focus on repeat purchase ratio and purchase frequency.
Ready to improve your customer retention? Start by calculating your current metrics with our free Customer Service Metrics Calculator, then use these insights to build a retention strategy that drives sustainable growth.
The Importance of Customer Retention
Customer retention is a secret growth engine. It might seem logical that the key to growth is acquiring new customers, and that is important. However, retaining and satisfying existing customers is an even stronger strategy for building a sustainable, profitable business.
Loyal customers are the lifeblood of profitable, established companies. They spend more per transaction and make more purchases than new customers, and they attract high-quality leads through their advocacy and word of mouth. By focusing on improving the quality of customer relationships and measuring customer retention metrics, organizations can achieve the immense value of customer loyalty.
Improving customer retention metrics requires a holistic strategy focused on solving for the customer. To see numbers climb, businesses must reduce friction in the customer journey, continuously improve their products, optimize the onboarding process, and regularly act on customer feedback from NPS surveys.
Tracking customer retention metrics in an old-fashioned spreadsheet is a drag and often prevents teams from quickly identifying insights to act on. To bridge the gap, teams need tools that automate data collection and visualize customer retention trends.
Start tracking customer retention metrics today with HubSpot Service Hub, or plug some numbers in right now to HubSpot’s Customer Service Metrics Calculator for a customer retention health check.
Net Promoter, Net Promoter System, Net Promoter Score, NPS and the NPS-related emoticons are registered trademarks of Bain & Company, Inc., Fred Reichheld and Satmetrix Systems, Inc.
Editor's note: This post was originally published in January 2018 and has been updated for comprehensiveness.
Free Customer Service Metrics Calculator
Calculate your business's key metrics and KPIs for customer support, service, and success with this free template.
- Customer Acquisition Cost
- Customer Lifetime Value
- Customer Satisfaction Score
- And More!
Download Free
All fields are required.
Form not available
![How to calculate churn rate in 5 easy steps [definition + formula]](https://53.fs1.hubspotusercontent-na1.net/hubfs/53/ai%20customer%20service%20predictions%20(3).webp)
![How to conduct survey analysis like a data pro [all my tips + secrets]](https://53.fs1.hubspotusercontent-na1.net/hubfs/53/survey-results-1-20241031-6355381.webp)
![Customer Profiling in 10 Easy Steps [+ Templates]](https://53.fs1.hubspotusercontent-na1.net/hubfs/53/customer-profiling_2.webp)

![What is a customer journey map? The complete overview [examples + templates]](https://53.fs1.hubspotusercontent-na1.net/hubfs/53/%5BUse-Oct-08-2025-10-53-10-8746-PM.webp)
![How to Get B2B Customer Segmentation Right [+Tips]](https://53.fs1.hubspotusercontent-na1.net/hubfs/53/b2b-customer-segmentation-1-20250109-7176487.webp)
-2.png)

![7 Customer Acquisition Challenges You Might Face This Year [New Data]](https://53.fs1.hubspotusercontent-na1.net/hubfs/53/customer%20acquisition%20%20(1).webp)