

In this guide, I’ll show you how to test, analyze, and optimize your way to higher website conversions.
Table of Contents
- What is A/B website testing?
- How to A/B Test a Website
- A/B Testing Metrics: What to Measure
- Pro Tips for A/B Testing Your Website
- Optimize and Repeat
What is A/B website testing?
In marketing, A/B testing is a controlled experiment in which you compare two versions of marketing collateral, such as an ad, landing page, or app, to determine which performs better.
A/B website testing, specifically then, refers to running these experiments on a website. It could be that you’re testing elements on a landing page, homepage, product page, checkout page, or some other page.
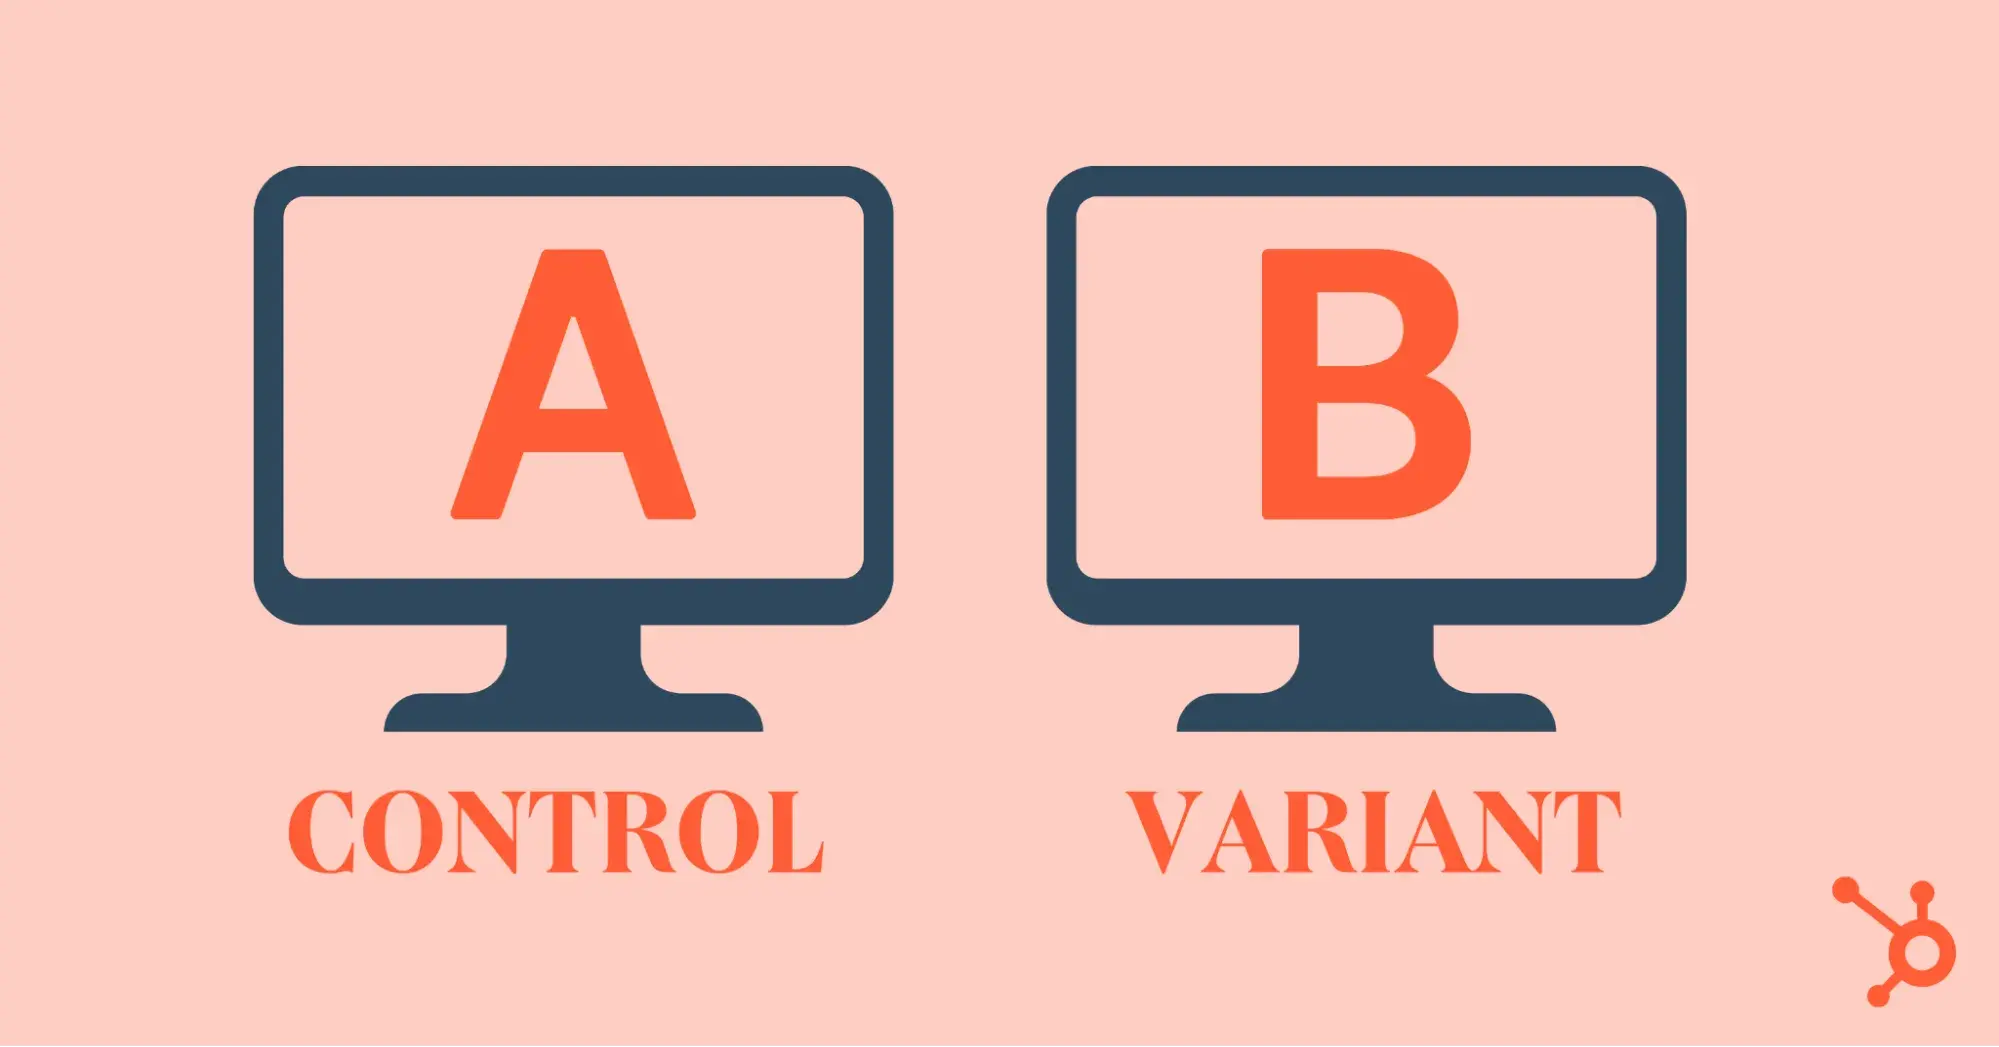
The first version is the current version of the page. This version is known as the Control version or Version A. The second version, which includes the change you’re testing, is known as the Variant, Challenger, or simply Version B.
Here’s a practical overview of an A/B website test and what it might reveal:
Imagine you run an ecommerce store and want to increase the number of people adding products to their carts. You hypothesize that a more prominent “Add to Cart” button will increase conversions. So, you create two versions of your product page.
The Control uses a small red “Add to Cart” button, while the Variant uses a larger green button.
By running an A/B test, you track user behavior and discover that Variant leads to a 12% increase in add-to-cart actions. Now you know your audience prefers a large green button.
This data-driven change directly boosts sales.
Split Test vs. A/B Test: What’s the Difference?
People often use the terms split test versus A/B test interchangeably. And rightly so.
An A/B test, going by the standard procedure, is expected to show your Control and Variant to the same number of people.
For instance, if you have an audience of 1000 people for your test, you’re expected to show Version A to 500 people and Version B to the other 500. The equal traffic parts or split is what makes it a split test.
So, an A/B test only differs from a split test when you don’t show each variation to the same number of people.
However, I’d not encourage you to do so, as it skews results and increases the risk of inaccurate conclusions.
.png)
The Complete A/B Testing Kit for Marketers
Start improving your website performance with these free templates.
- Guidelines for effective A/B testing
- Running split tests for email, landing pages, and CTAs
- Free simple significance calculator
- Free A/B test tracking template.
Download Free
All fields are required.
Form not available
How to A/B Test a Website
So, you’ve been tasked with improving your website’s lead generation. You’ve got traffic, but the sign-ups aren’t where they should be.
Where do you start? A/B testing your website can help pinpoint what works and what doesn’t.
Here’s how I would approach an A/B website test.
Psst: If you’d rather watch how to do A/B testing, this video is for you.
Step #1: Identify the goal and hypothesis.
First things first — what exactly do you want to improve?
You may have noticed that many people visit your landing page but do not fill out the form. Or your homepage receives a lot of traffic, but very few visitors click on your call-to-action (CTA) button.
These are issues you can investigate with an A/B test.
Tie your goal to an actionable metric, like increasing conversions, reducing bounce rates, or improving click-through rates.
Once you know your goal, create a hypothesis. Think of it as an educated guess based on user behavior.
For example, your hypothesis could be: Changing the CTA button from “Learn More” to “Get Started Free” will increase conversions by 15%.
This hypothesis sets the stage for your test and keeps you focused on measurable improvements tied to your business goals.
Step #2: Choose the right page and element to test.
Not all pages are equal. If you want to move the needle, focus on high-impact areas where conversions matter most.
Corey Haines, co-founder of Conversion Factory, a marketing agency specializing in CRO for SaaS, uses this method.
He says, “We always start with high-traffic pages, then use heatmaps to see where users focus the most. Usually, it’s the hero section, pricing page, and sign-up page.”
Aside from high-traffic pages, common pages and elements to test include:
- Landing pages from Google Ads or email campaigns.
- Hero section elements like the headline, subheads, or CTAs.
- Form field design like the length, required info, or placement.
This approach ensures you’re testing elements that will have a tangible impact on conversions.
Let’s say your company offers an online subscription service. Your pricing page receives many visits, but people hesitate to sign up. You could try changing the headline to emphasize risk-free trials, adjusting the CTA placement, or simplifying the plan comparison table.
To select pages in HubSpot, navigate to Content in your HubSpot account. From the sub-menu, choose whether to test Landing Pages or Website Pages.
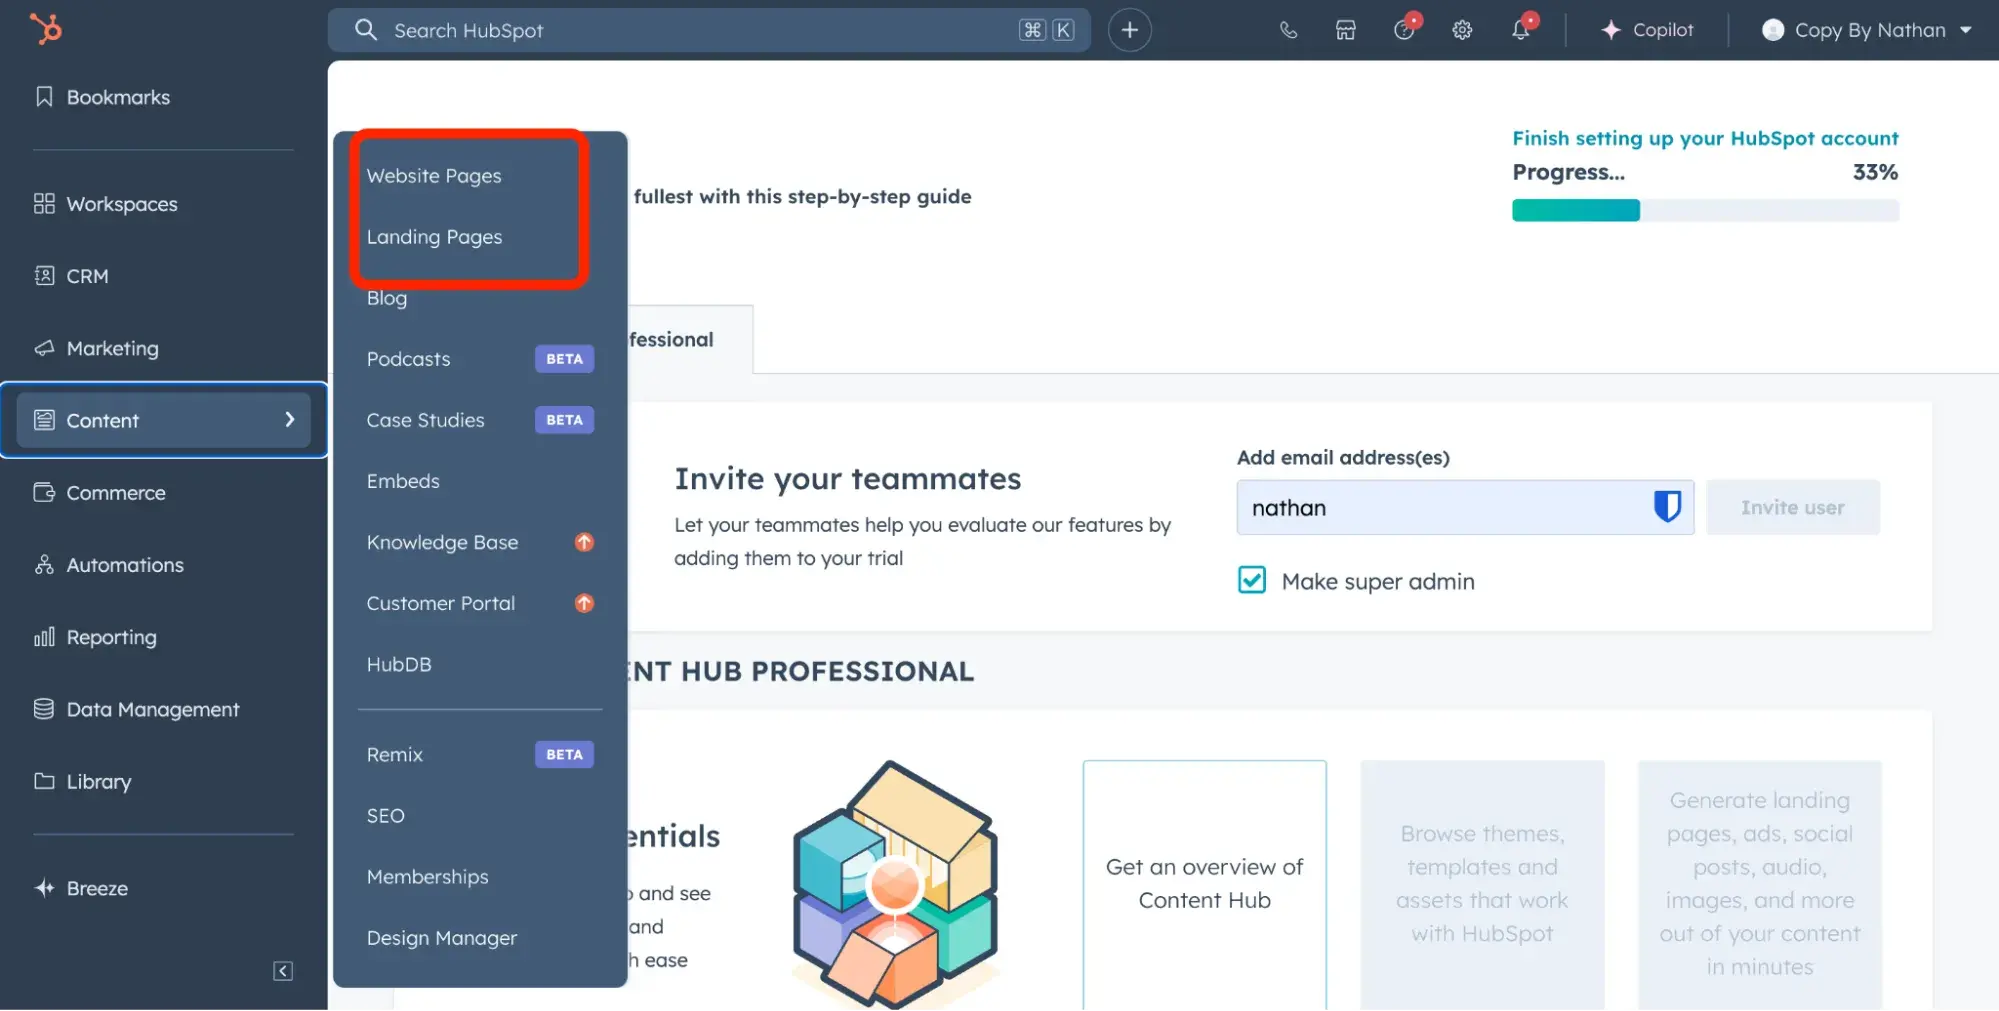
In my case, I’m using a sample pricing page.
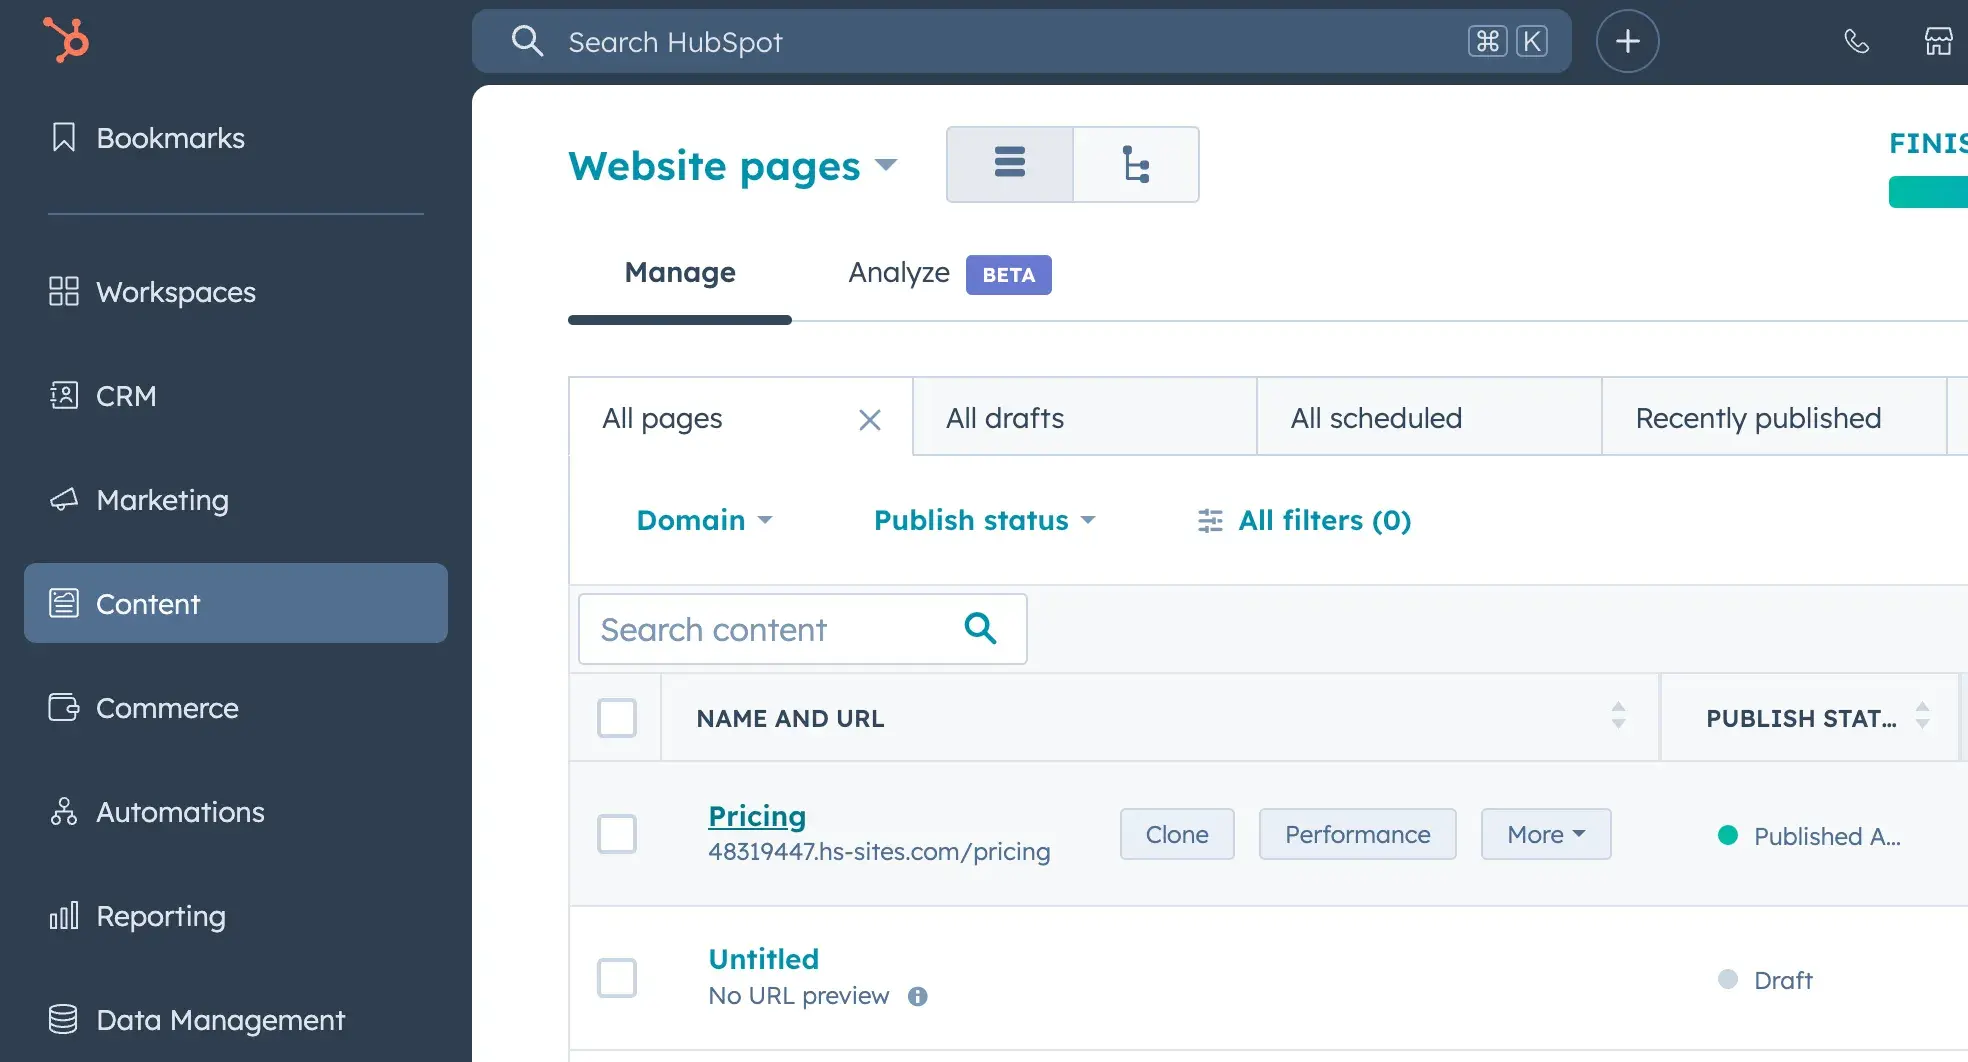
Click the name of the page you want to test.
Step #3: Create the A and B variants.
Now, it’s time to create your test variations.
Your Version B or Variant should be relevant to the goals and hypothesis in Step #1.
Here’s how to create variants on HubSpot.
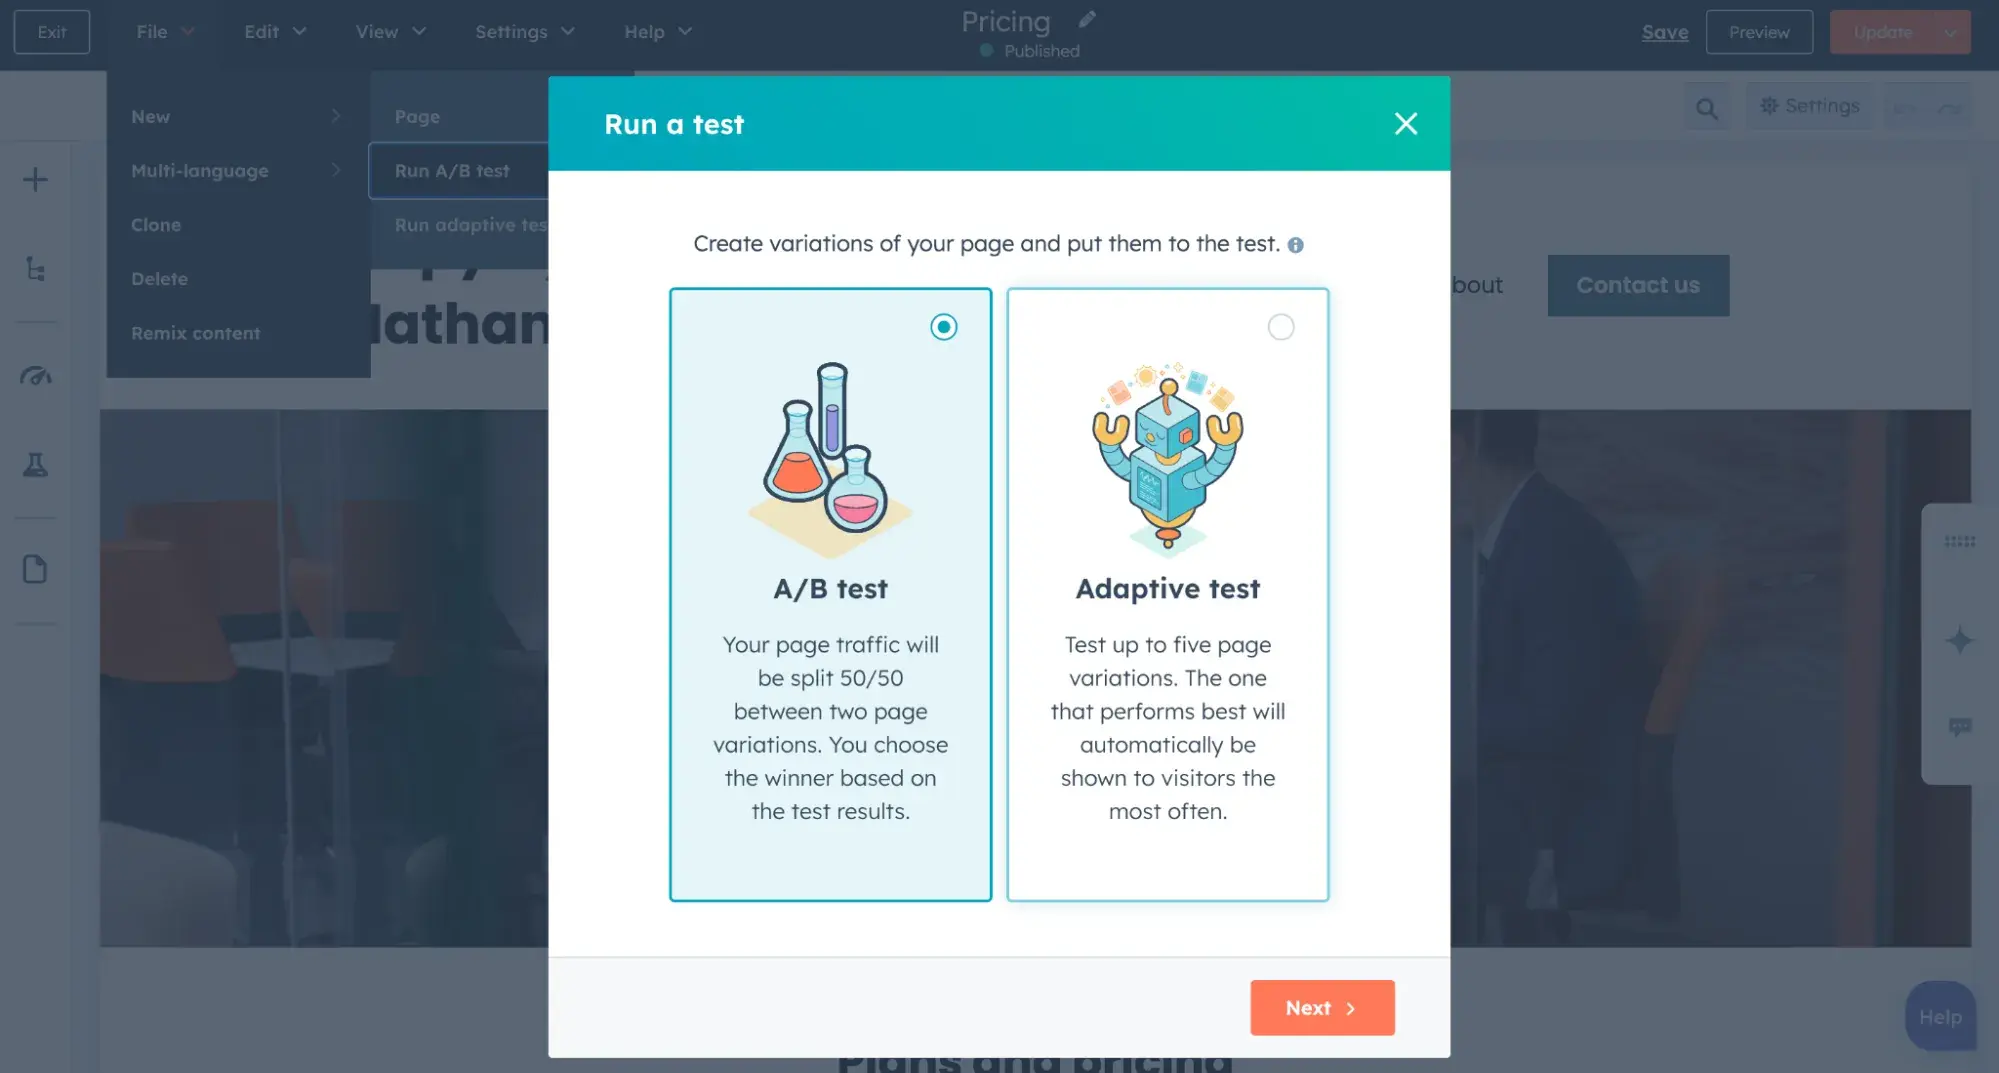
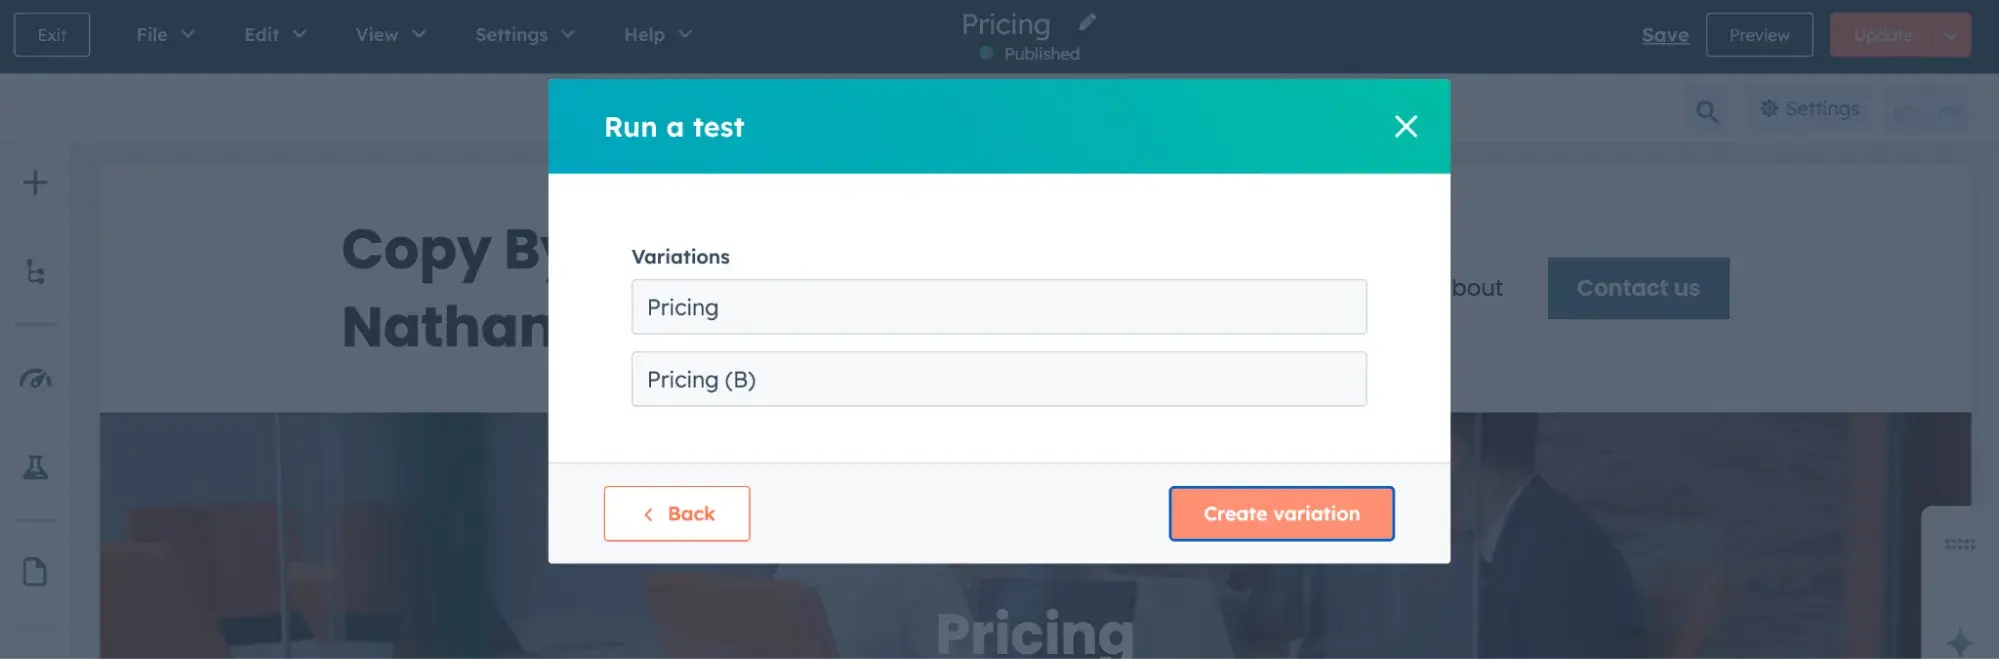
- Click the File menu on the page you’ve chosen and select New > Run A/B test.

- In the dialog box, choose A/B Test, then click Next.
- Enter a name for each page variation, then click Create variation.
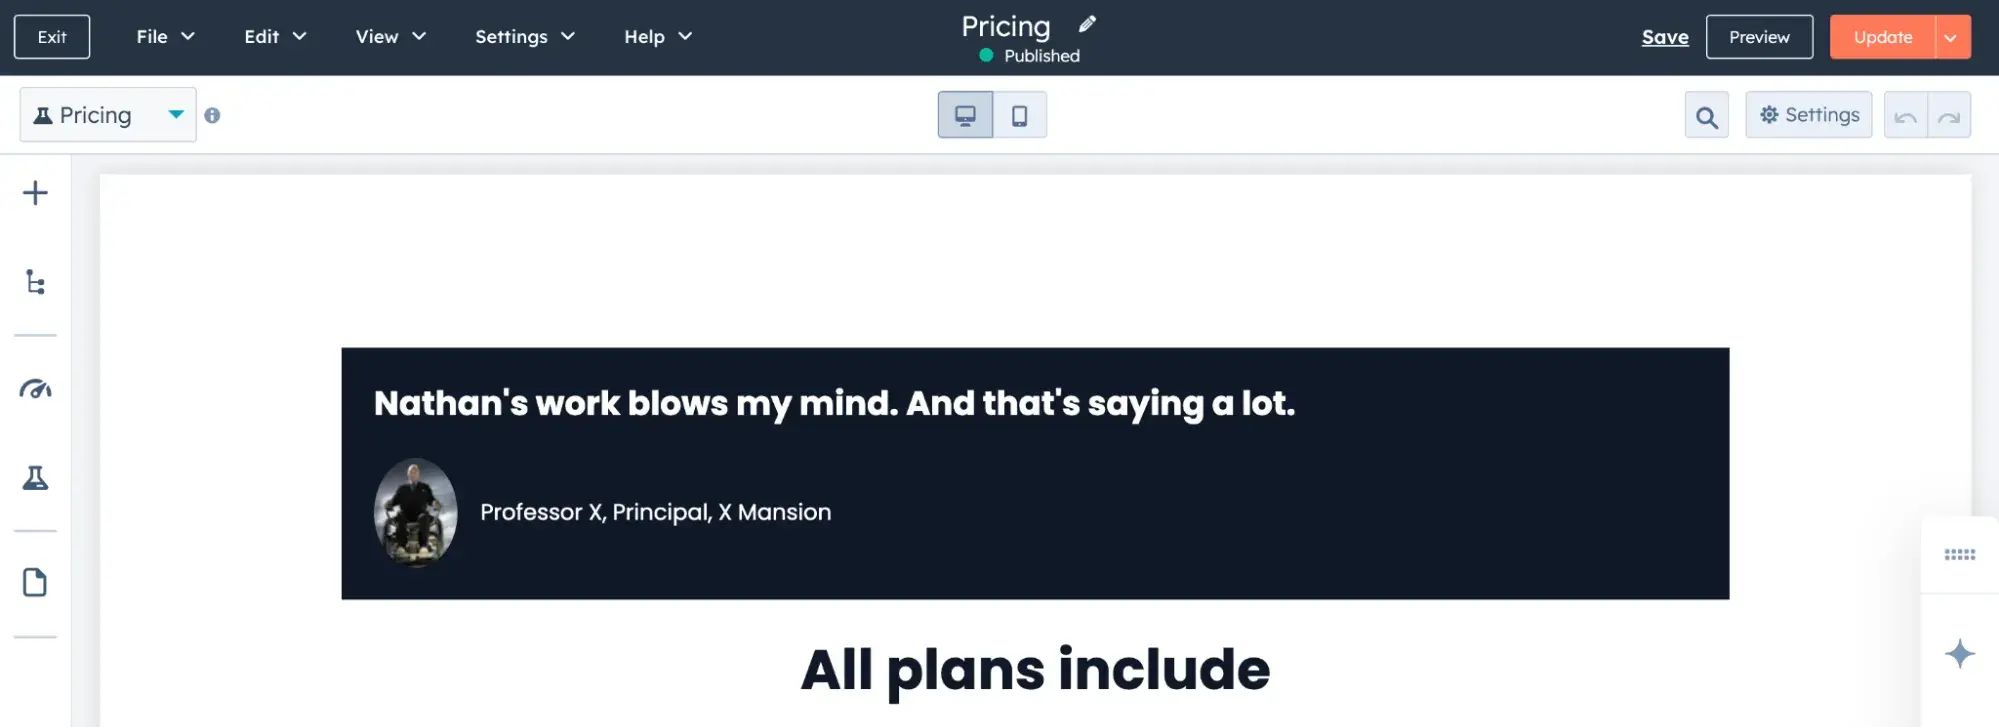
- In the content editor, update the content for your page variation based on your hypothesis and goals.
In my example, I added a testimonial to the Control, while the Variant didn’t have any.
Step #4: Set up the test using an A/B testing tool.
Here comes the execution phase.
You’ll need an A/B testing tool to divide traffic between Versions A and B and track and analyze results.
Popular tools include:
Need more tools? Here’s a complete list of A/B testing tools.
Note: Some of these tools are free, while you might have to pay upwards of $599/month for others. Don’t fret yet. You can still achieve so much with these free tools.
Start with them, then move to the expensive ones as your needs grow.
Pro tip: To help choose the right A/B testing tool, I like to explore the following:
- Whether it has features I need.
- What the customer service or support is like.
- Whether this tool will slow my website down.
- How much technical know-how I need to use the tool.
- How well the tool integrates with other tools in my tech stack.
- The pricing. Not just the initial costs but accumulating costs when I add more team members or need more features.
Step #5: Define the sample size and duration.
This is where patience comes in. You need enough website visitors to draw statistically significant conclusions.
If your website has a lot of daily traffic, a week or two should be enough. If traffic is lower, let the test run for a month or more.
A/B testing tools typically tell you when a result is statistically significant, but a test is said to be statistically significant if there is less than 5% chance that the results happened by chance.
In other words, you have at least 95% confidence that the changes you made, not some external factor, caused the difference in the test results.
The Complete A/B Testing Kit for Marketers
Start improving your website performance with these free templates.
- Guidelines for effective A/B testing
- Running split tests for email, landing pages, and CTAs
- Free simple significance calculator
- Free A/B test tracking template.
Download Free
All fields are required.
Form not available
One method to find your audience size is the one Nicole Silver, director of marketing at Superpower, suggests for landing pages. Here’s what she told me:
“Use Google Analytics to find how much traffic the page typically gets over a two-week period. Then scale the experiment based on how much traffic you’re expecting.”
She likes to target around 5000-10000 people for her tests.
Pro tip: You can also use the significance test calculator in HubSpot’s A/B Testing Kit to know how large your sample size needs to be to achieve a significant result.
Step #6: Run the test and analyze the results.
While the test is running, keep an eye on the numbers. Watch your primary metric (e.g., conversions, sign-ups), but don’t ignore secondary indicators like bounce rates or session duration.
After the test ends comes the real challenge: correctly interpreting the results. In their book, A/B Testing, Dan Siroker and Pete Koomen highlight the danger of confirmation bias. Such bias makes you see what you want to see rather than what the data truly indicates.
Siroker and Koomen’s advice? “True optimization happens when teams dig into why a change performed the way it did, not just that it performed differently.”
Step #7: Iterate and retest.
A/B testing is never one-and-done. Even if your test is successful, there’s always room for improvement. Maybe the new CTA works, but could it be even more persuasive with social proof? Could a different layout further boost engagement?
Concerning iterations, Andrew Gould, a freelance direct response copywriter with 16 years of experience, recommends that you “see where else the result can be applied. See if there's potential to test the same element again or move on to another element.”
You’ll never know until you test.
And what if the test doesn’t give the results you wanted?
I asked Silver, and she says, “If your test’s performance continues to be poor after a week, you can turn it off and try something else. You don’t need to tank anything else to prove a point.”
Now, you might be wondering about the results of my own test. Unfortunately, the results were intangible because I didn’t have enough traffic.
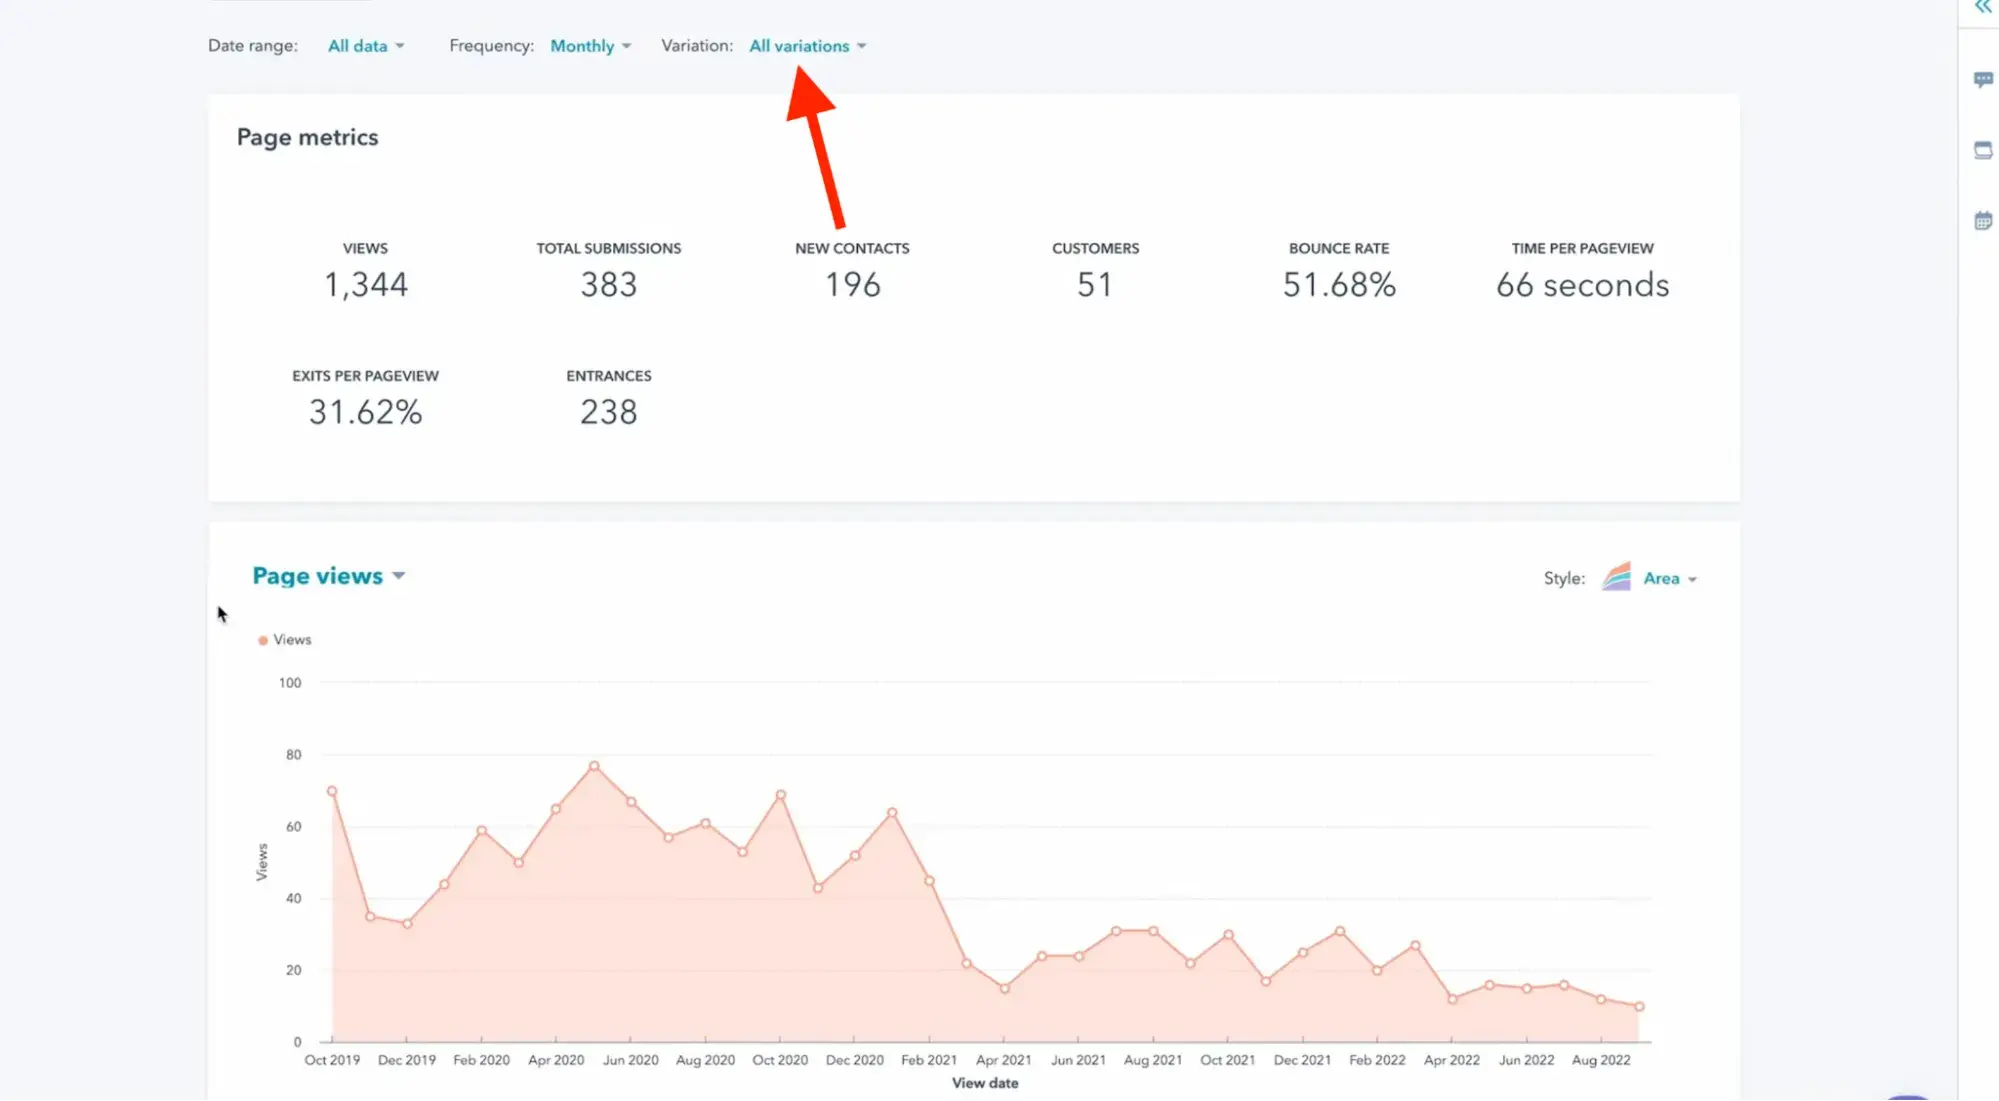
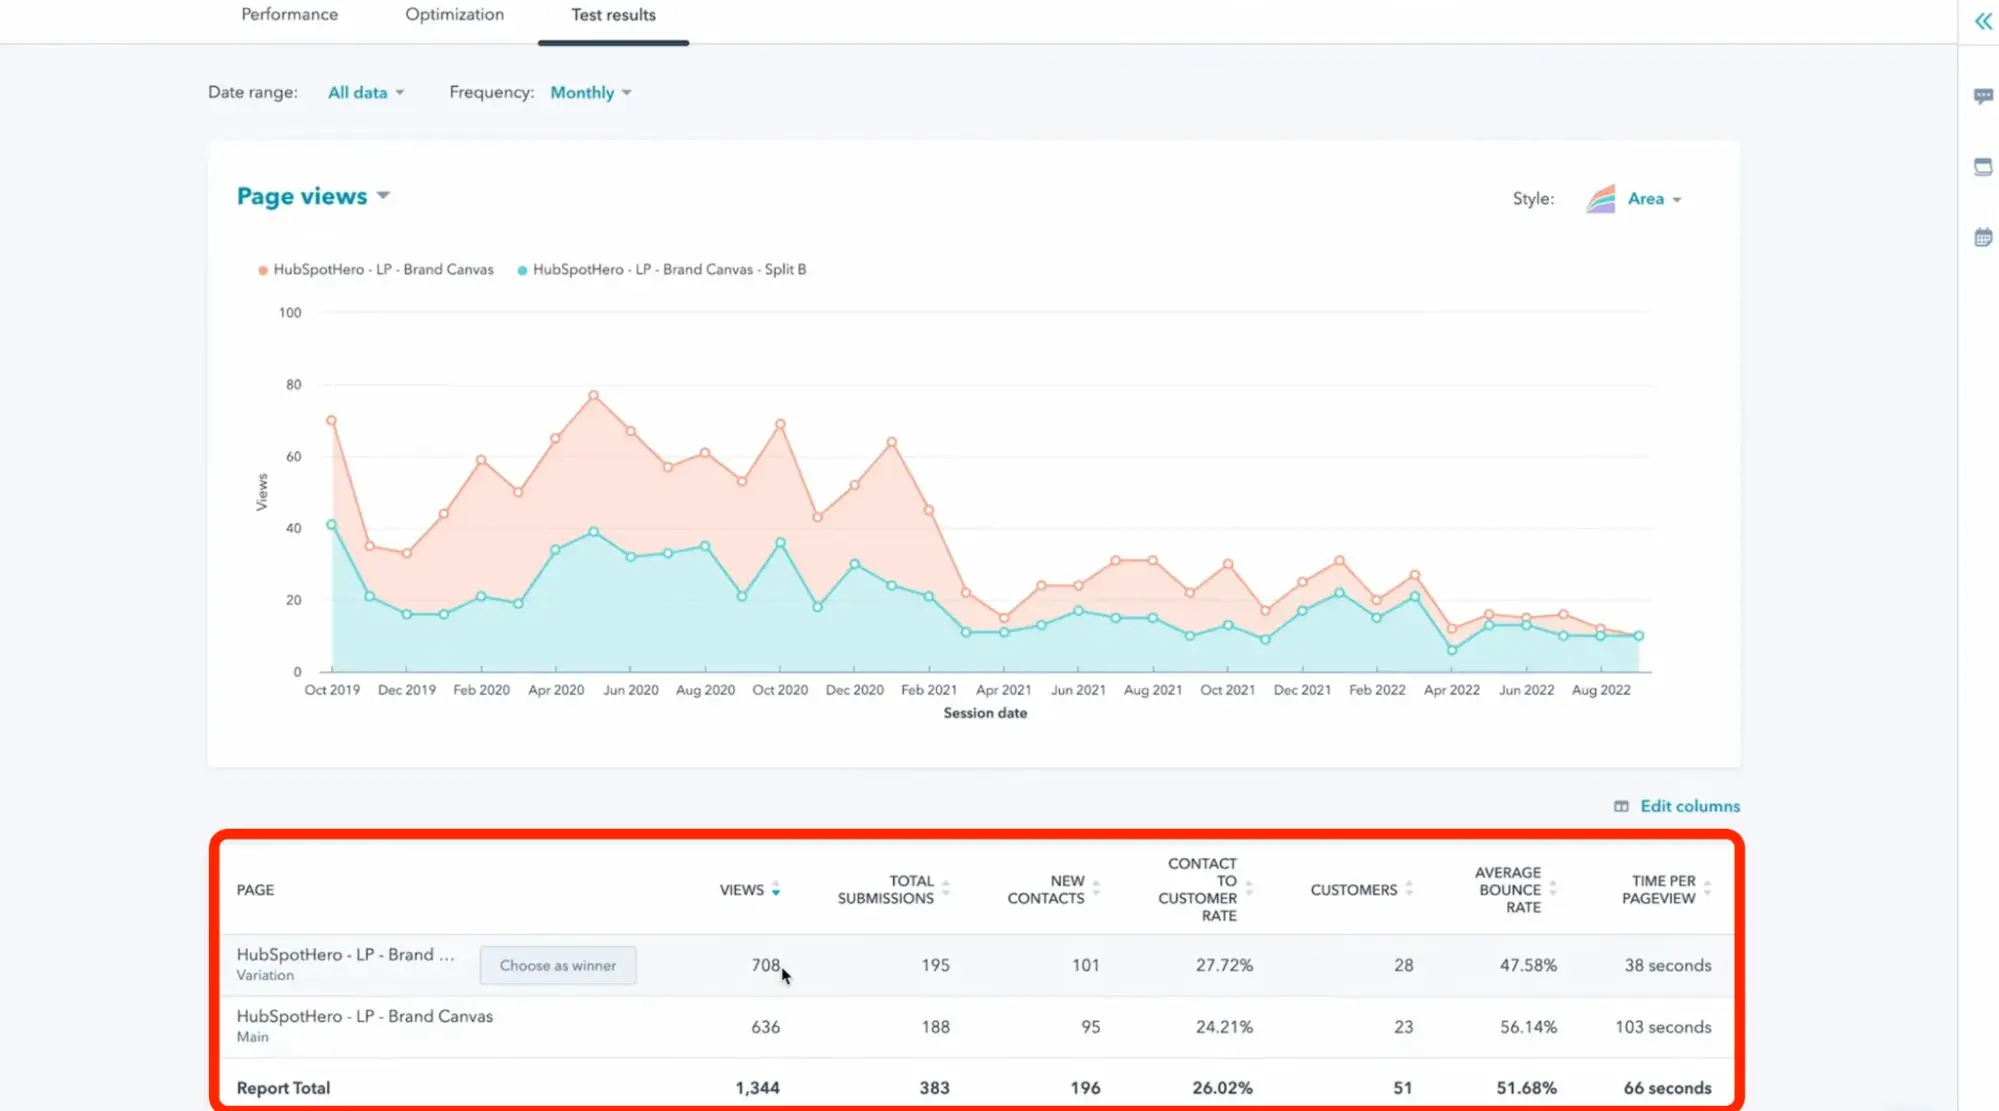
But I’m not going to leave you hanging. If you had enough traffic, the result should look like this in HubSpot. (And here’s the rundown on how to run an A/B test specifically in HubSpot.)
https://www.youtube.com/watch?v=eMZI36GXw3I
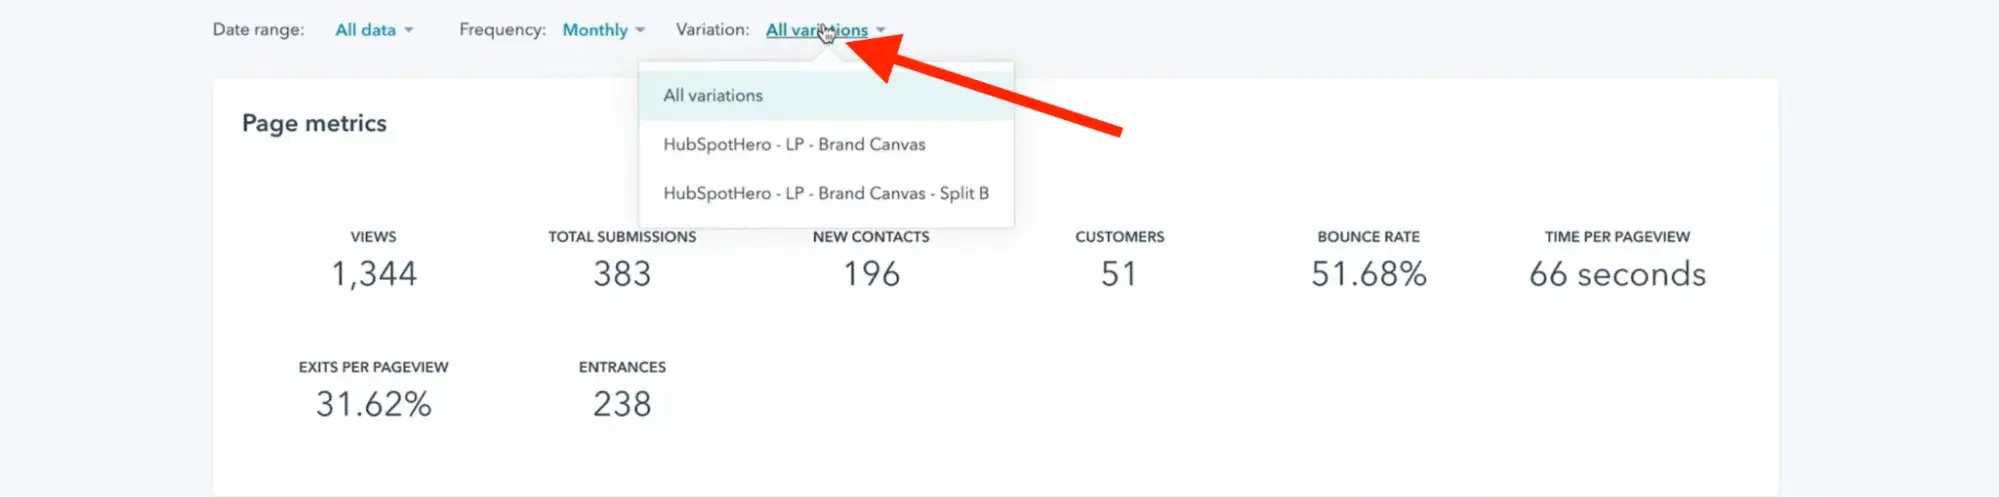
Here, you can see metrics such as total form submissions, sales, bounce rate, and more from both variations. And if you want, you can view the stats from individual variations.
https://www.youtube.com/watch?v=eMZI36GXw3I
On the Test Results tab, you’ll find a graph comparing these stats more visually. HubSpot also allows you to choose the winner test and make it the main page visitors land on.
https://www.youtube.com/watch?v=eMZI36GXw3I
A/B Testing Metrics: What to Measure
At this point, you’ve run your test, and now you need to figure out what the numbers actually mean.
While it’s easy to get caught up in vanity metrics, I believe the key to A/B testing is focusing on data that directly impacts your bottom line.
Here are the most important metrics to track and how they help you make sense of your test results.
1. Conversion Rate
Most marketers track conversion rates to determine whether their tests were successful. This metric answers the question: Did the change I tested lead to more people taking action?
Whether it’s signing up for a newsletter, making a purchase, or filling out a form, conversion rate tells you if your variation worked.
For example, let’s say you tested a new sign-up form with fewer required fields. If Version B increases sign-ups from 2% to 3%, that’s a 50% improvement in conversion rate.
Here’s how to calculate the conversion rate: (Conversions / Visitors) × 100.
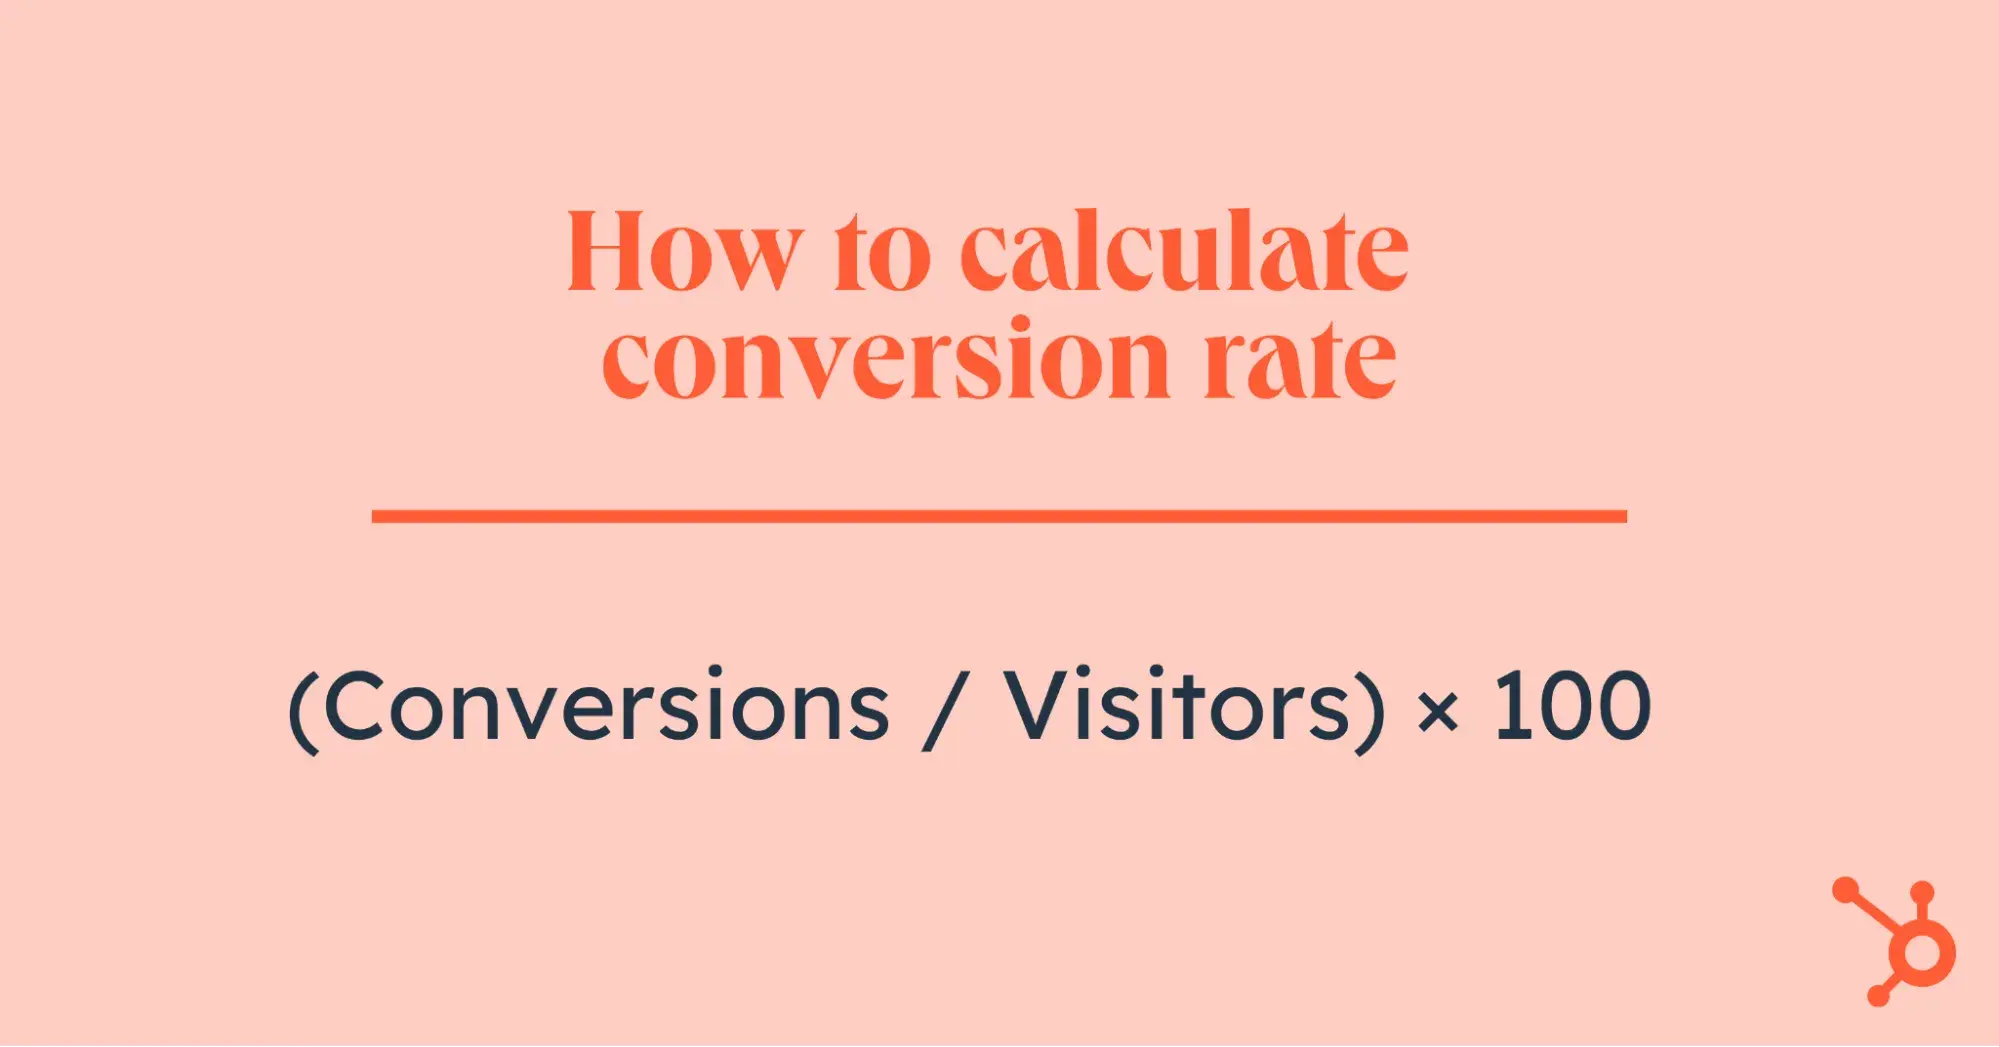
Conversions in this formula mean the number of website visitors who take a desired action.
2. Click-Through Rate (CTR)
CTR tells you how many people clicked on a key element — usually a CTA. It’s a great indicator of whether your headlines, buttons, or links are grabbing attention.
Imagine you changed your homepage CTA from “Learn More” to “Start Free Trial.” If clicks on the CTA button jump from 5% to 7%, you know the new wording is more compelling.
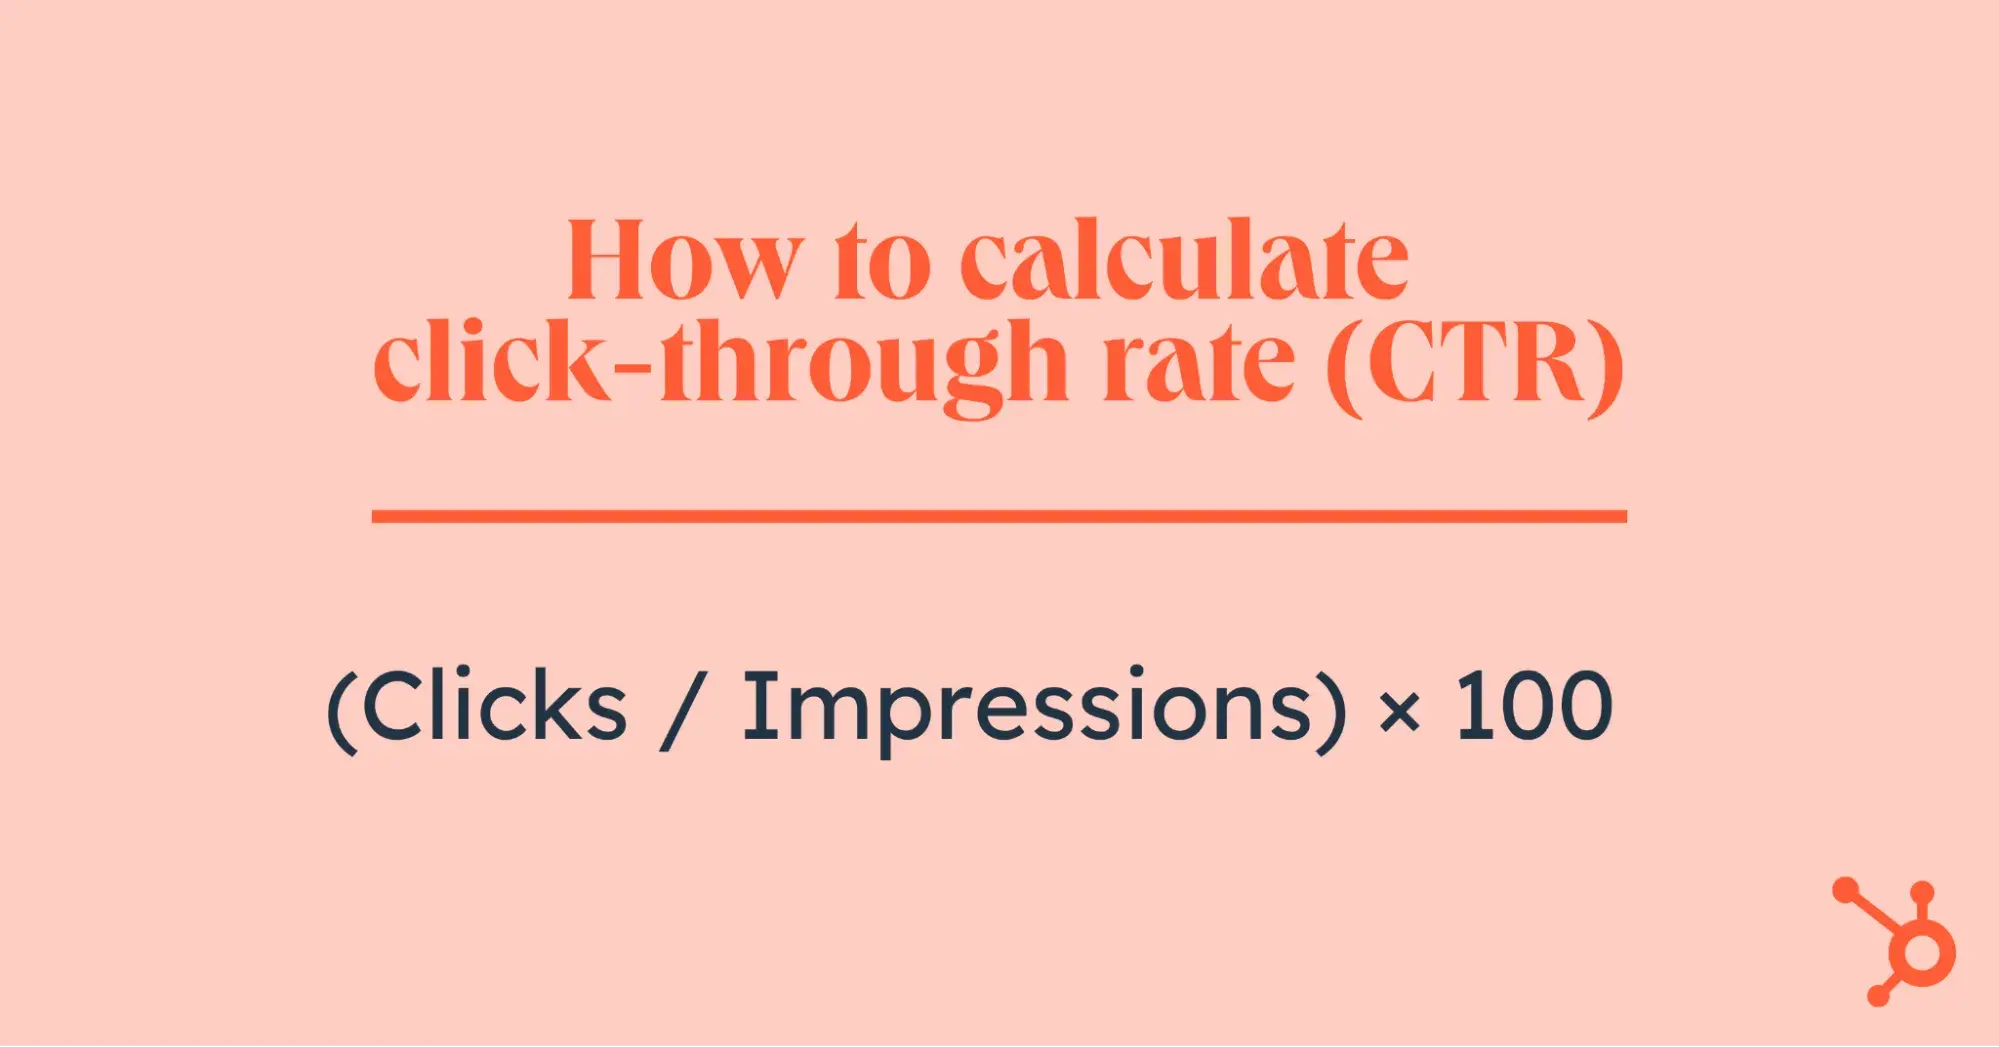
Here’s the formula: (Clicks / Impressions) × 100.
3. Bounce Rate
Bounce rate measures the percentage of visitors who leave your site without taking any action. A high bounce rate can indicate that your page isn’t engaging enough or that the test variation pushes people away instead of drawing them in.
For example, you redesign a landing page to make it more visually appealing, but bounce rates go up instead of down. That tells you that the new design might be confusing or not aligned with user expectations.
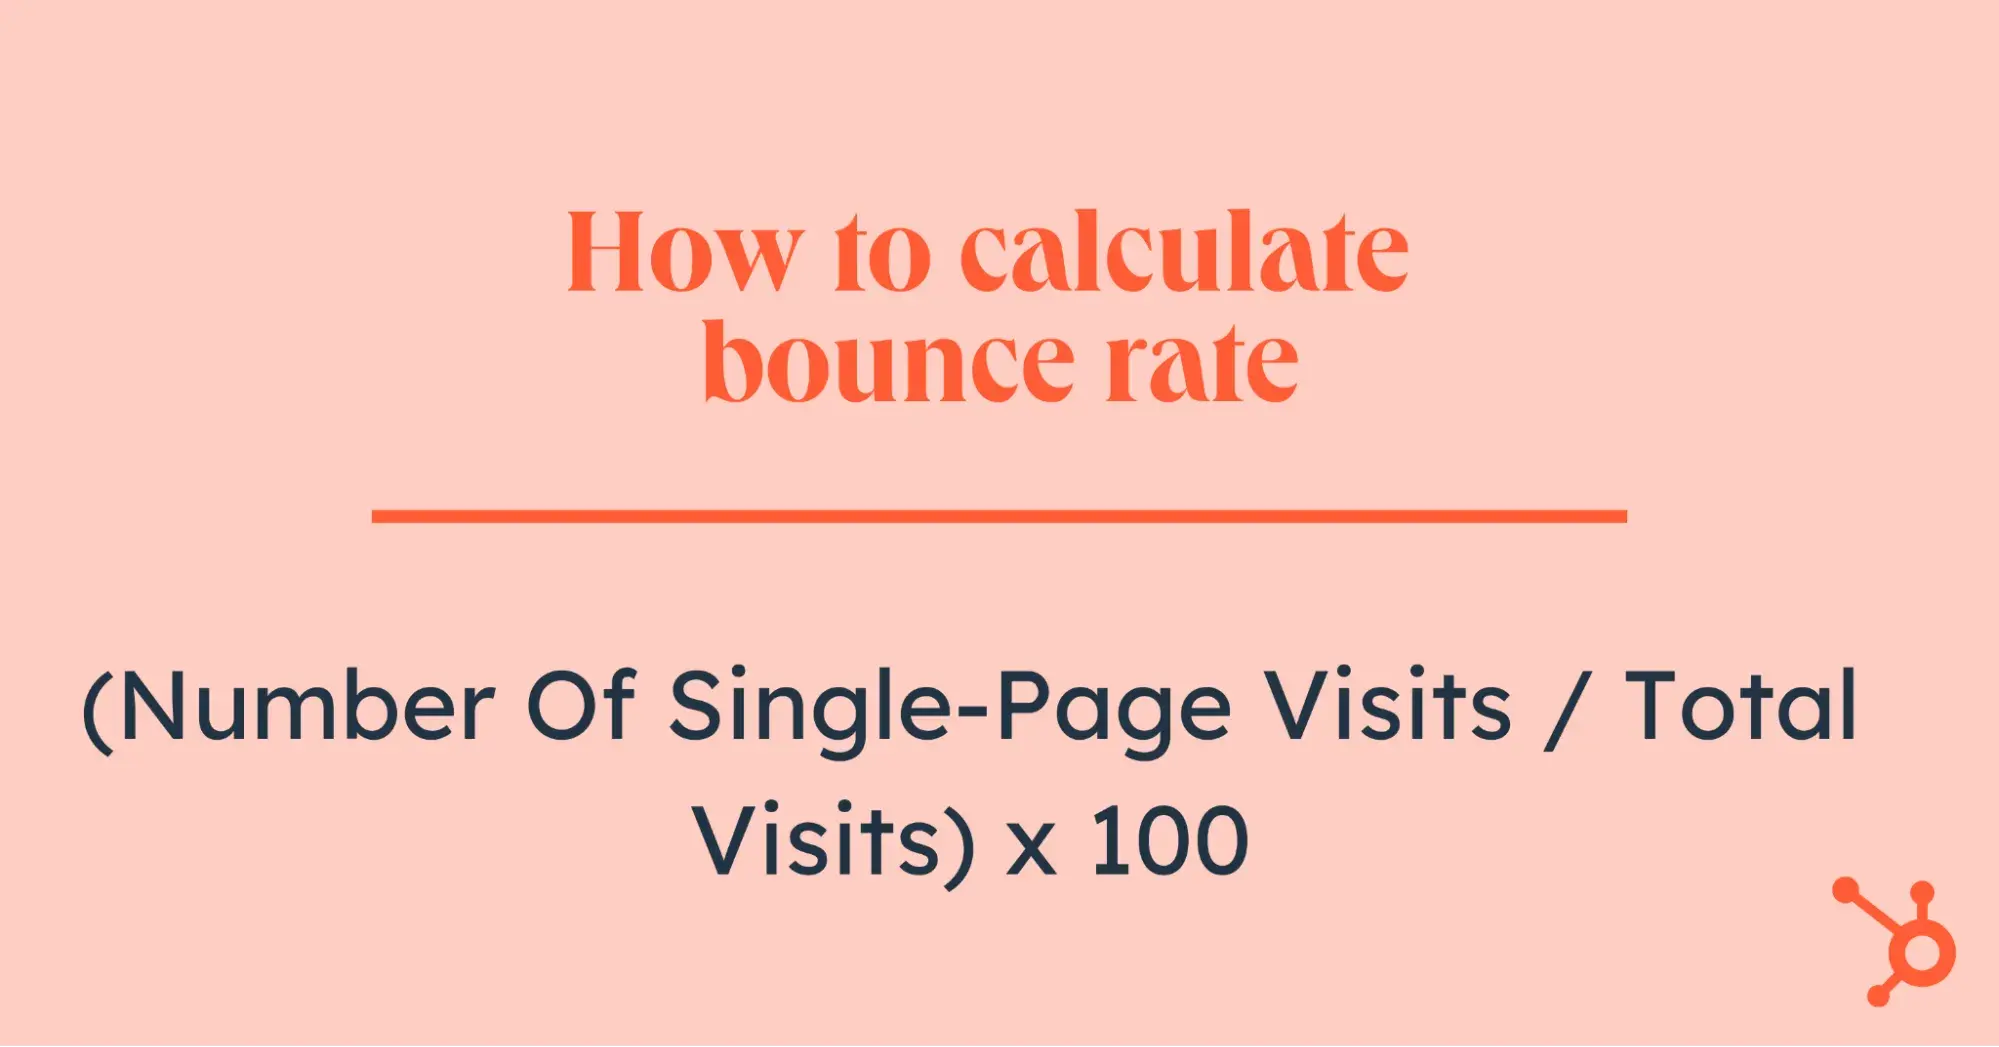
Use this formula to calculate your bounce rate: (Number of Single-Page Visits / Total Visits) x 100.
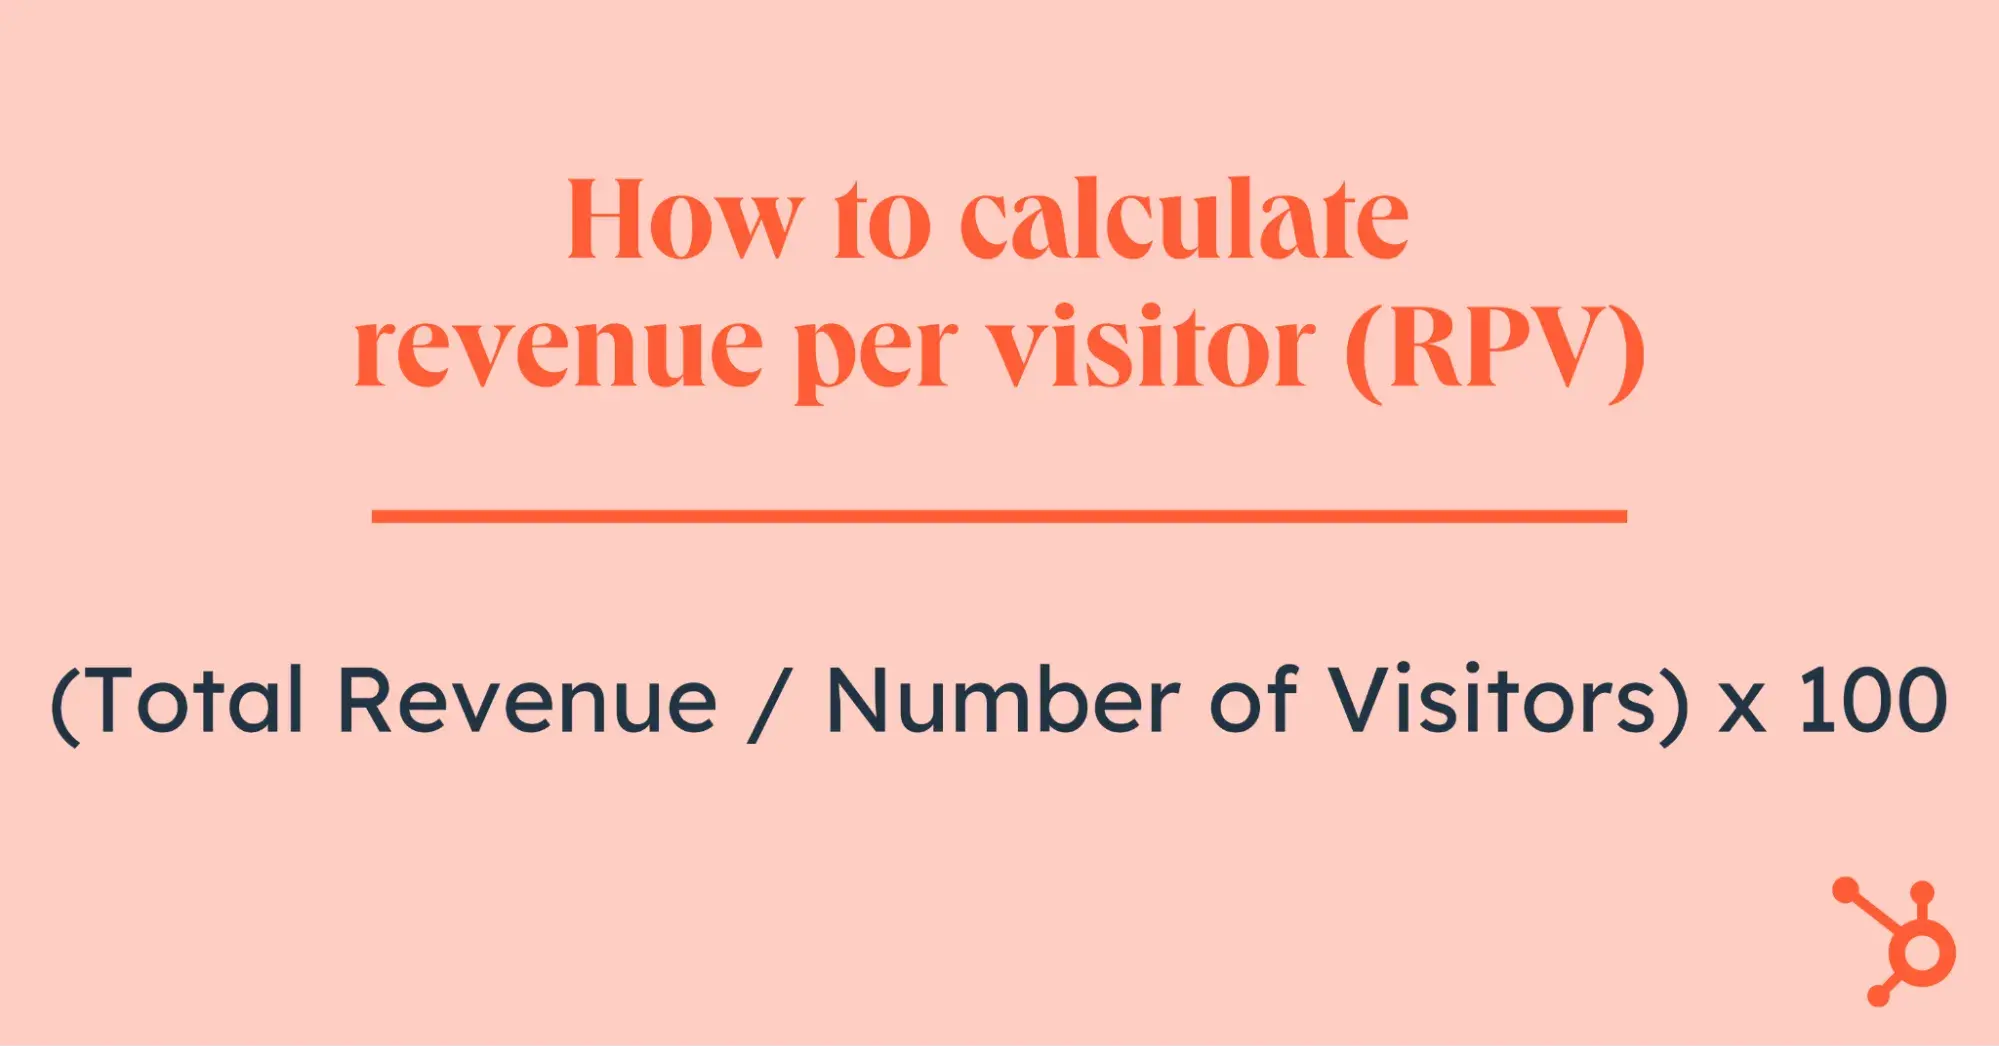
4. Revenue per Visitor (RPV)
For ecommerce and subscription-based businesses, RPV helps you understand the real impact of your test on revenue. This metric is crucial because you could convert more visitors but generate less revenue.
For instance, you could be generating $300 from 30 sales on your Control page while the Variant brings in $300 from 35 sales.
That means you’re converting more visitors — but possibly at the cost of lower per-sale revenue.
To calculate your RPV, use this formula: (Total Revenue / Number of Visitors) x 100.
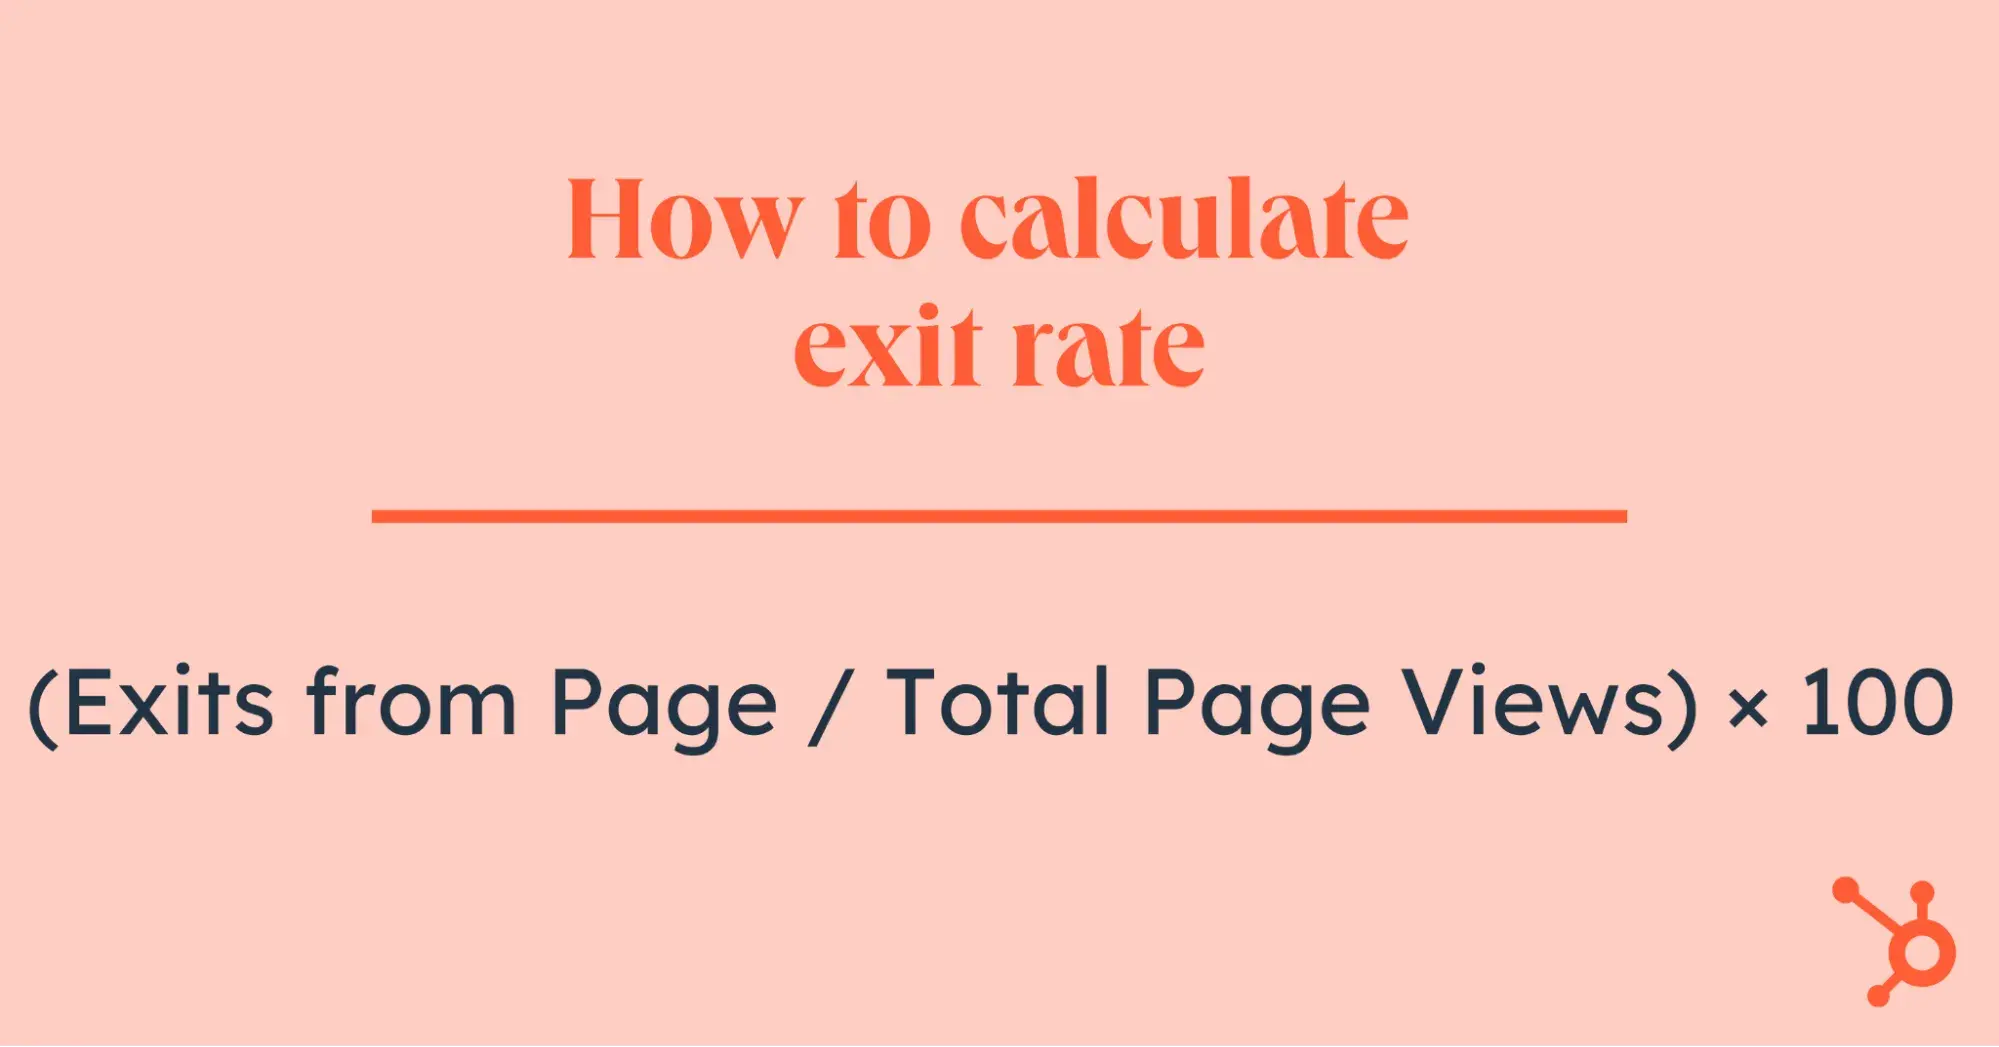
5. Exit Rate
Exit rate tells you the percentage of visitors who leave your site from a specific page. Unlike bounce rate, which tracks single-page visits, exit rate helps you pinpoint which pages are causing users to abandon your site.
The Complete A/B Testing Kit for Marketers
Start improving your website performance with these free templates.
- Guidelines for effective A/B testing
- Running split tests for email, landing pages, and CTAs
- Free simple significance calculator
- Free A/B test tracking template.
Download Free
All fields are required.
Form not available
For example, a high exit rate on your checkout page might indicate friction in the purchase process, such as unexpected costs or a complicated form.
Here is the formula: (Exits from Page / Total Page Views) × 100.
6. Form Abandonment Rate
If your A/B test involves optimizing a form (such as a sign-up or checkout form), the form abandonment rate tells you how many users start filling it out but don’t complete it.
Say you reduce the number of required fields on a form and see form abandonment drop by 25%. This drop is a sign that fewer fields create a better experience.
To calculate the form abandonment rate, use this formula: (Visitors Who Start Form - Visitors Who Complete Form) / Visitors Who Start Form × 100.

7. Page Load Time
Page speed affects everything from bounce rate to conversions. If your A/B test involves design changes, tracking page load time ensures enhancements don’t slow down performance.
You can use tools like Google PageSpeed Insights and Pingdom to test your website speed and page load time.
Pro Tips for A/B Testing Your Website
To maximize your A/B testing efforts, these expert-backed tips from industry professionals will help ensure your tests yield actionable results.
1. Test big, meaningful changes (not just button colors).
I know, I know — red versus blue buttons is the classic A/B test. But in most cases? It’s not going to move the needle in a big way.
Siroker & Koomen say, “If a test result doesn’t move the needle, you probably tested something too small to matter.”
To emphasize this tip, Haines highlights Seth Godin’s recommendation. He says, “Seth recommends ‘A/J testing’ — test radically different versions, not just minor changes.”
How did such changes work for Haines? He told me, “We recently ran an A/B test for a client who only wanted to test a new hero section on their home page. Our hypothesis was that the hero did a good job of engaging warm traffic, but failed to hook in cold traffic.
“So we built a new hero section that had very clear copywriting on the value and loaded it with social proof.”
The result?
Haines continues: “After a month, it was clear that there was a 20% lift in conversions with the new hero.”
The positive effect of skipping the small changes is also seen in ThriveThemes’ sales page test.
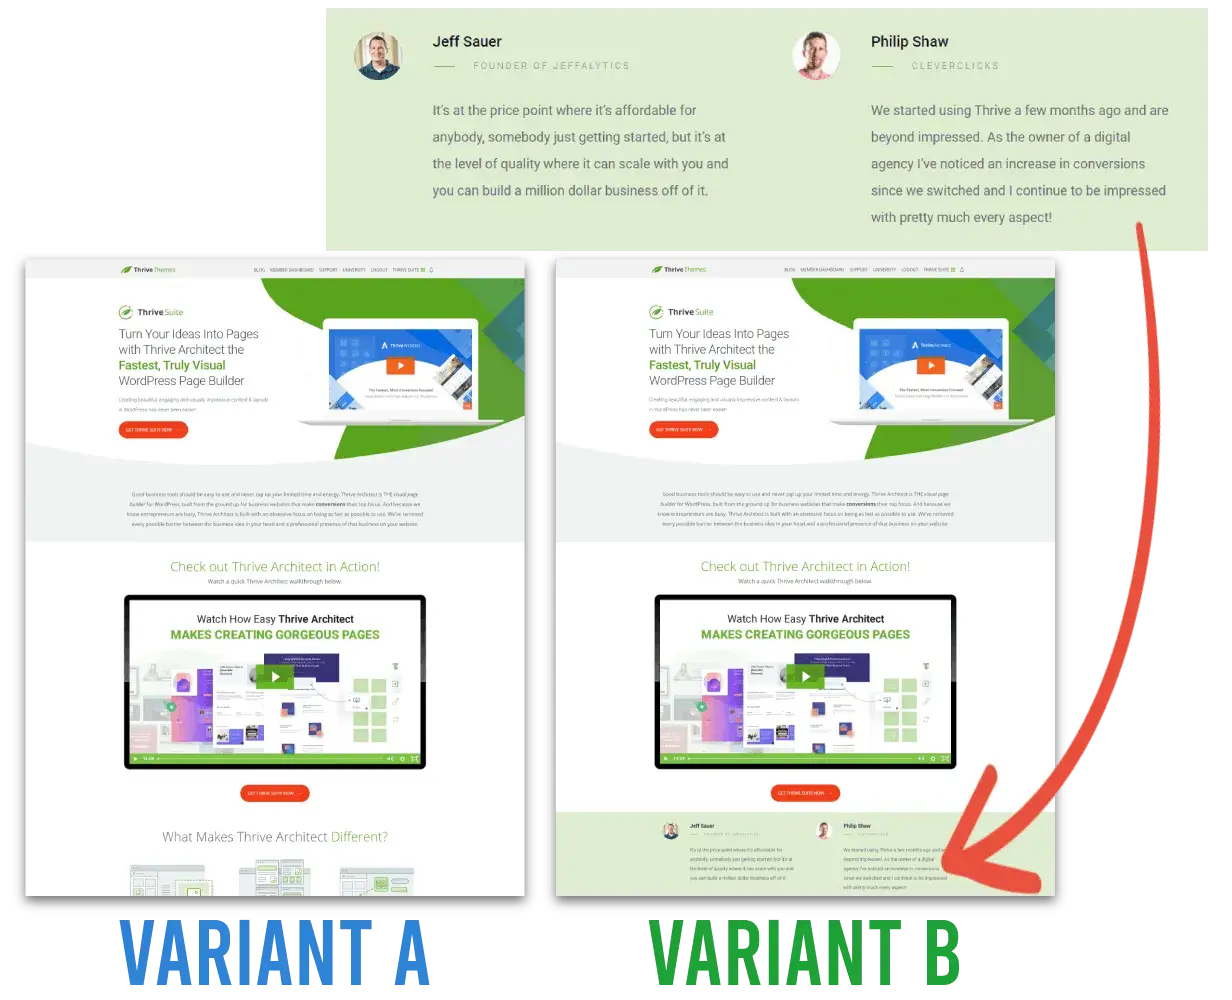
By making a meaningful change, such as adding a testimonial, they improved sales conversion by 25%.
Impressive, right?
2. Segment your traffic.
Not all visitors behave the same way.
First-time visitors behave differently than returning users. Mobile users interact differently than desktop users.
So, why test them as if they’re a monolith?
Instead, you should segment your traffic before testing. You can use a tool like Google Analytics to do this.
And Silver has some advice: “If you’re running tests on multiple pages, you need to be careful about who sees them and how much control you have over each page. For example, if you’re running a landing page test with a ton of ads funneling into it, you can’t also be running another test where the same audience will see that page and engage with it.”
The reason is that it could be confusing and change the test results. Imagine landing on a landing page with a specific message, and you get to the final conversion point, and it says something different or looks different. It could throw you off.
“So, keep something like an editorial calendar to track your tests so you know what tests are being exposed to who and when,” Silver concludes.
3. Don’t ignore external factors like timing.
Let’s say you ran an A/B test and saw a huge spike in conversions. Awesome, right?
Well, what if that happened because of an external factor like a big news event, a competitor dropping out, or even seasonality like Black Friday?
I’d advise running tests across different periods to rule out the chances of external noise influencing them.
4. Track the entire funnel.
It’s easy to get excited when a test increases CTRs, but what should you really care about? Gould answers: “Clicks are great, but what matters is long-term retention and revenue.”
Instead of optimizing for just one metric, always look at the bigger picture.
Ask yourself:
- Are users who click actually converting?
- Does the test impact revenue, not just engagement?
- Are there any unintended side effects?
- Down the funnel, did you achieve the goal you wanted?
Avoid declaring a test successful based only on surface-level improvements (e.g., clicks, form fills). The fix is to track full-funnel metrics (sign-ups, purchases, retention) through a user’s journey to measure long-term impact.
Pro tip: If an A/B test improves one metric but harms another, dig deeper before implementing the change.
The Complete A/B Testing Kit for Marketers
Start improving your website performance with these free templates.
- Guidelines for effective A/B testing
- Running split tests for email, landing pages, and CTAs
- Free simple significance calculator
- Free A/B test tracking template.
Download Free
All fields are required.
Form not available
5. Be patient and let the test run.
You likely get excited when you see early results in an A/B test. If one version outperforms the other in the first few days, you might be tempted to stop the test and roll out the “winner.”
But here’s the problem: I’ve found that early results are often misleading.
Just because one version is ahead early doesn’t mean it will stay that way, especially if you’re testing on a small sample size. The natural variation in user behavior can cause random fluctuations, and if you stop a test too early, you risk making decisions based on bad data.
Gould recommends that “a test should run until statistically significant, but usually at least a week to account for different buying behaviors on different days.”
Haines explains that determining the length of a test “can be tricky for sites that don‘t get a ton of traffic. Usually we’re able to get to some semblance of statistical significance within 3 months if there isn't traffic.”
So really, the length of the test will depend on your unique situation.
However, just because you’re patient doesn’t mean your test should run forever. “Audience fatigue happens when your audience keeps seeing the same message,” says Silver. “As such, it’s crucial to put a cap on the test duration.”
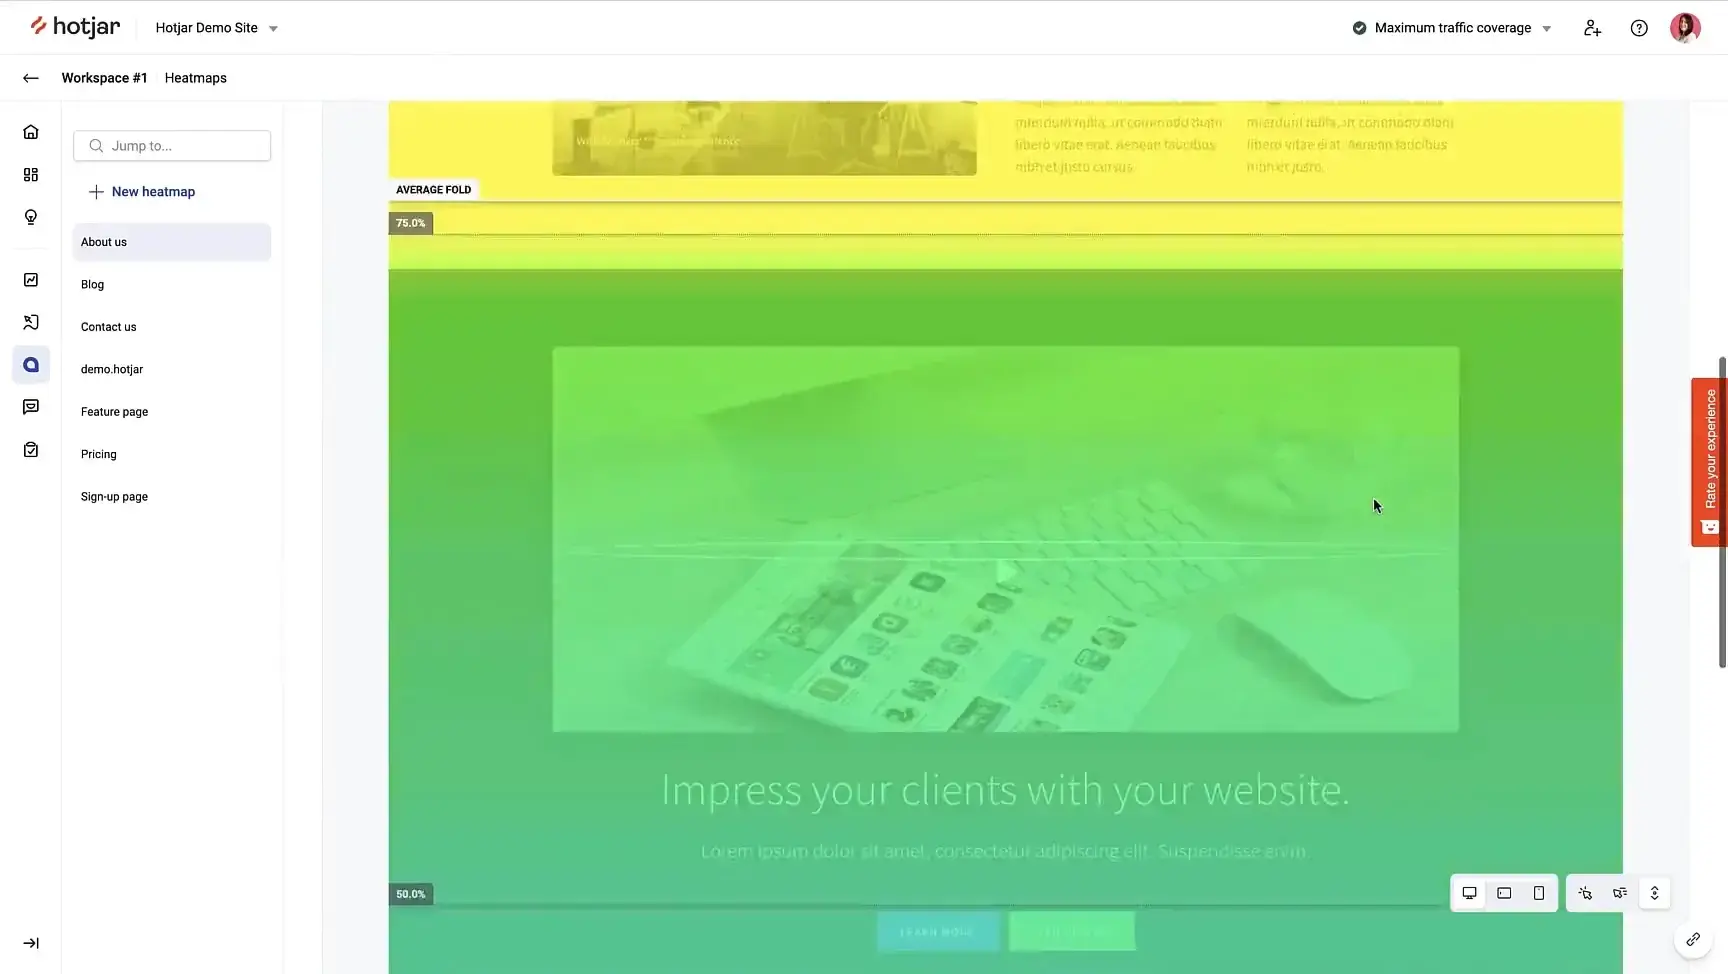
6. Use heat maps and session recordings.
Quantitative metrics (clicks, conversions) show what happened, but qualitative tools like Hotjar and Mircosoft Clarity have heat maps and session recording features that show why the behavior happened.
Using these tools, you can uncover pain points and behaviors that numbers don’t reveal.
7. Leverage AI for smarter testing.
Using artificial intelligence in A/B testing is a no-brainer. With AI, you can analyze vast amounts of data to identify patterns and predict outcomes, helping you prioritize high-impact tests.
For example, AI can analyze form analytics data to identify problematic fields, provide content recommendations, automatically segment users based on behavior, recommend optimal test durations, or even suggest new hypotheses based on historical data.
Tools like EvolvAI and Adobe Target are primarily powered by AI to streamline the testing process and deliver actionable insights.
Integrating AI into your A/B testing strategy allows you to stay ahead of the curve and achieve better results with less guesswork.
Optimize and Repeat
A/B testing isn’t a superpower, but it’s the next best thing. It turns guesses into data-driven decisions.
Instead of relying on guesswork, you get accurate data on what works and doesn’t, so you can make smarter decisions that actually move the needle.
I’ve learned that small tweaks can lead to big wins, but only if you test with intention, track meaningful metrics, and stay patient enough to let the data speak. And when a test doesn’t go as planned? That’s just another insight to fuel your next experiment.
Keep testing, keep iterating, and watch your website’s performance grow. Next, download HubSpot’s A/B Testing Kit for templates and even more guidance.
A/B Testing