
That's why I think it’s important to take some time to understand the metrics that matter, how to track them, and how to turn that data into meaningful insights for your content strategy. In this post, I'll walk you through all of it — from the specific metrics I rely on to the frameworks that make content performance analysis actually useful.
Based on my experience working with multiple of my sites, including one that cracked 10 million views in a year, here’s your complete guide to tracking, analyzing, and improving your content performance.
Table of Contents
- What is content performance?
- Why You Should Track Content Performance
- Content Performance Metrics to Track
- How to Level Up Your Content Performance
- Start measuring content performance today.
What is content performance?
Content performance refers to how well your marketing materials (blog posts, landing pages, emails, etc.) resonate with and engage your audience, achieve their intended goals, and ultimately, help your business’s bottom line.
To assess content performance, you can use a variety of different metrics, including engagement, SEO/AI visibility, conversions, and revenue. The basic idea is that these different metrics help you understand the performance of both individual pieces of content and your content strategy as a whole.
Types of Content You Can Measure
All content is measurable to varying degrees, but each content type has metrics tailored to its purpose and distribution channel. Let’s take a look at some below.
- Blog posts: Organic traffic, time on page, keyword rankings, AI citations, scroll depth
- Landing pages: Form submissions, conversion rate, bounce rate, cart additions
- Emails: Open rate, click-through rate, unsubscribe rate, conversions from email
- Webpages: Pageviews, session duration, navigation paths, goal completions
- Social media posts: Impressions, engagement rate (likes, comments, shares), click-throughs, follower growth
- Video content: Watch time, completion rate, engagement actions, referral traffic
The key is matching metrics to each content piece's goal. A brand awareness blog post and a product comparison landing page shouldn’t be evaluated with identical criteria.

HubSpot's Free Website Builder
Create and customize your own business website with an easy drag-and-drop website builder.
- Build a website without any coding skills.
- Pre-built themes and templates.
- Built-in marketing tools and features.
- And more!
Why You Should Track Content Performance
Content performance analysis is one of the most important parts of implementing a content marketing strategy. Without it, you're flying blind when it comes to assessing the actual impact of your content — and you risk losing resources when leadership can’t justify continued investment.
This is especially true right now. Traditional organic traffic is being disrupted by AI-generated search results from tools like ChatGPT, Gemini, and Perplexity, and the metrics that mattered two years ago may not tell the full story today. If you're not actively tracking performance — including how your content surfaces in AI-powered search — you’re working with an incomplete picture.
According to Content Marketing Institute's B2B Content and Marketing Trends: Insights for 2026 report, 40% of effective marketing teams say “measurement and reporting” is one of the factors that improved their marketing effectiveness over the past year. Meanwhile, “measuring content effectiveness” ranks among the top three content marketing challenges, with 33% of B2B marketers saying it's a struggle.
In other words, the teams that figure out measurement gain a real competitive edge. Here's why.
1. Optimize how you use resources.
Tracking content performance helps ensure that you're using your financial and human resources as efficiently as possible.
For example, if you discover that a certain type of content is driving a ton of conversions and offering a positive return on investment (ROI), you might want to double down and invest even more time and money into that type of content. Conversely, you might discover that a content format you've been pouring resources into is underperforming — data that could save your team significant time and budget.
This matters because content budgets are growing and leadership expects accountability. In CMI's B2B Content and Marketing Trends: Insights for 2026 research (surveying over 1,000 B2B marketers), AI-powered marketing tools topped the list of areas where B2B marketers expect to make the most investment or increase investment in 2026, with 45% selecting it as a top-three priority. Events and experiential marketing (33%) and owned media (32%) followed close behind. With marketers actively reshuffling where their money goes, the pressure to demonstrate what each investment is producing only increases.
If you don't know the ROI of your content, you might be underspending or overspending on your content marketing efforts, and it will be difficult to effectively manage your resources.
2. Create a more effective content strategy.
Content performance tracking doesn't just tell you what happened — it helps you figure out what to do next.
By looking at performance data, you'll be able to answer important questions like:
- What topics work best on my site?
- What content formats work best on my site?
- Where are visitors finding my content?
- How are visitors engaging with my content?
You can use all of these answers (and more) to make your content strategy more effective — and avoid the common trap of producing content based on assumptions rather than evidence. As CMI's B2B research puts it: “Teams winning in 2026 aren't playing with prompts, churning out more content, or managing to the algorithms. They're building stronger muscles in marketing fundamentals.”
3. Boost conversion rates from your content.
Finally, tracking content performance can help you boost your conversion rates and more effectively use your content to achieve your business goals.
In my experience, it can be easy for content marketers to overly focus on top-of-funnel metrics like page views. While page views are certainly important, I think the most important metric is usually conversions — how effectively your content helps you achieve your actual business goals, whether those are growing your email lists, generating leads, or selling products.
According to CMI's B2B Content Marketing Benchmarks, Budgets, and Trends: Outlook for 2025, 87% of B2B marketers said content marketing helped create brand awareness, and 74% said it generated demand and leads.
But getting those results requires tracking conversion rates and trying to accurately attribute them to your content. Doing so will help you answer questions like:
- What content format converts the best?
- What topics convert the best?
- What types of calls-to-action (CTA) convert the best?
Content Performance Metrics to Track
At this point, I hope you’re convinced about the necessity of tracking the performance of your content. Now, I want to shift from the “why” into the “how.”
To generate an accurate content performance analysis, you’ll want to focus on a variety of different performance metrics across a few different categories:
- Engagement metrics
- SEO and AI visibility metrics
- Conversion and revenue metrics
Below, I’ll take you through what I think are some of the most important metrics from my own experience analyzing content performance, along with how you can start tracking them for yourself.
Before we dive in, check out the table below, which maps common content goals to the metrics that matter most for each one. Use it as a quick reference when deciding what to track.
|
Content Goal |
Primary Metric |
Supporting Metrics |
|
Brand awareness |
Brand mentions |
Impressions, keyword rankings, new users, share of voice |
|
Audience engagement |
Average engagement time |
Bounce rate, scroll depth, dwell time, traffic sources |
|
SEO visibility |
Keyword rankings |
Impressions, clicks, CTR, organic traffic |
|
AI visibility |
AI citations |
Brand mentions, share of voice |
|
Lead generation |
Form submissions/subscribers |
Conversion rate, landing page bounce rate, traffic source breakdown |
|
Revenue / ROI |
Revenue attributed to content |
Conversion rate, cost per content piece, customer acquisition from content |
Engagement Metrics
Users and Views
Tracking views and users lets you see how popular each piece of content is, along with how many people your entire content strategy is helping you connect with.
HubSpot's Free Website Builder
Create and customize your own business website with an easy drag-and-drop website builder.
- Build a website without any coding skills.
- Pre-built themes and templates.
- Built-in marketing tools and features.
- And more!
I recommend focusing on these three metrics:
- Users (active users). This metric counts the total number of unique users who have visited the page for your selected time period.
- Views. This metric counts the total number of page views for the selected time period. This number will always be greater than or equal to the number of users because each user must count as at least one page view, but one user could view the page multiple times within the selected time period (and therefore count as multiple views).
- New users. This metric counts the number of users who visited the page and have never visited your site before. For example, a regular reader of your site wouldn’t count as a new user, but someone who found your site for the first time in Google would.
In Google Analytics, you can track Active users and New users by going to Reports → Engagement → Landing page:
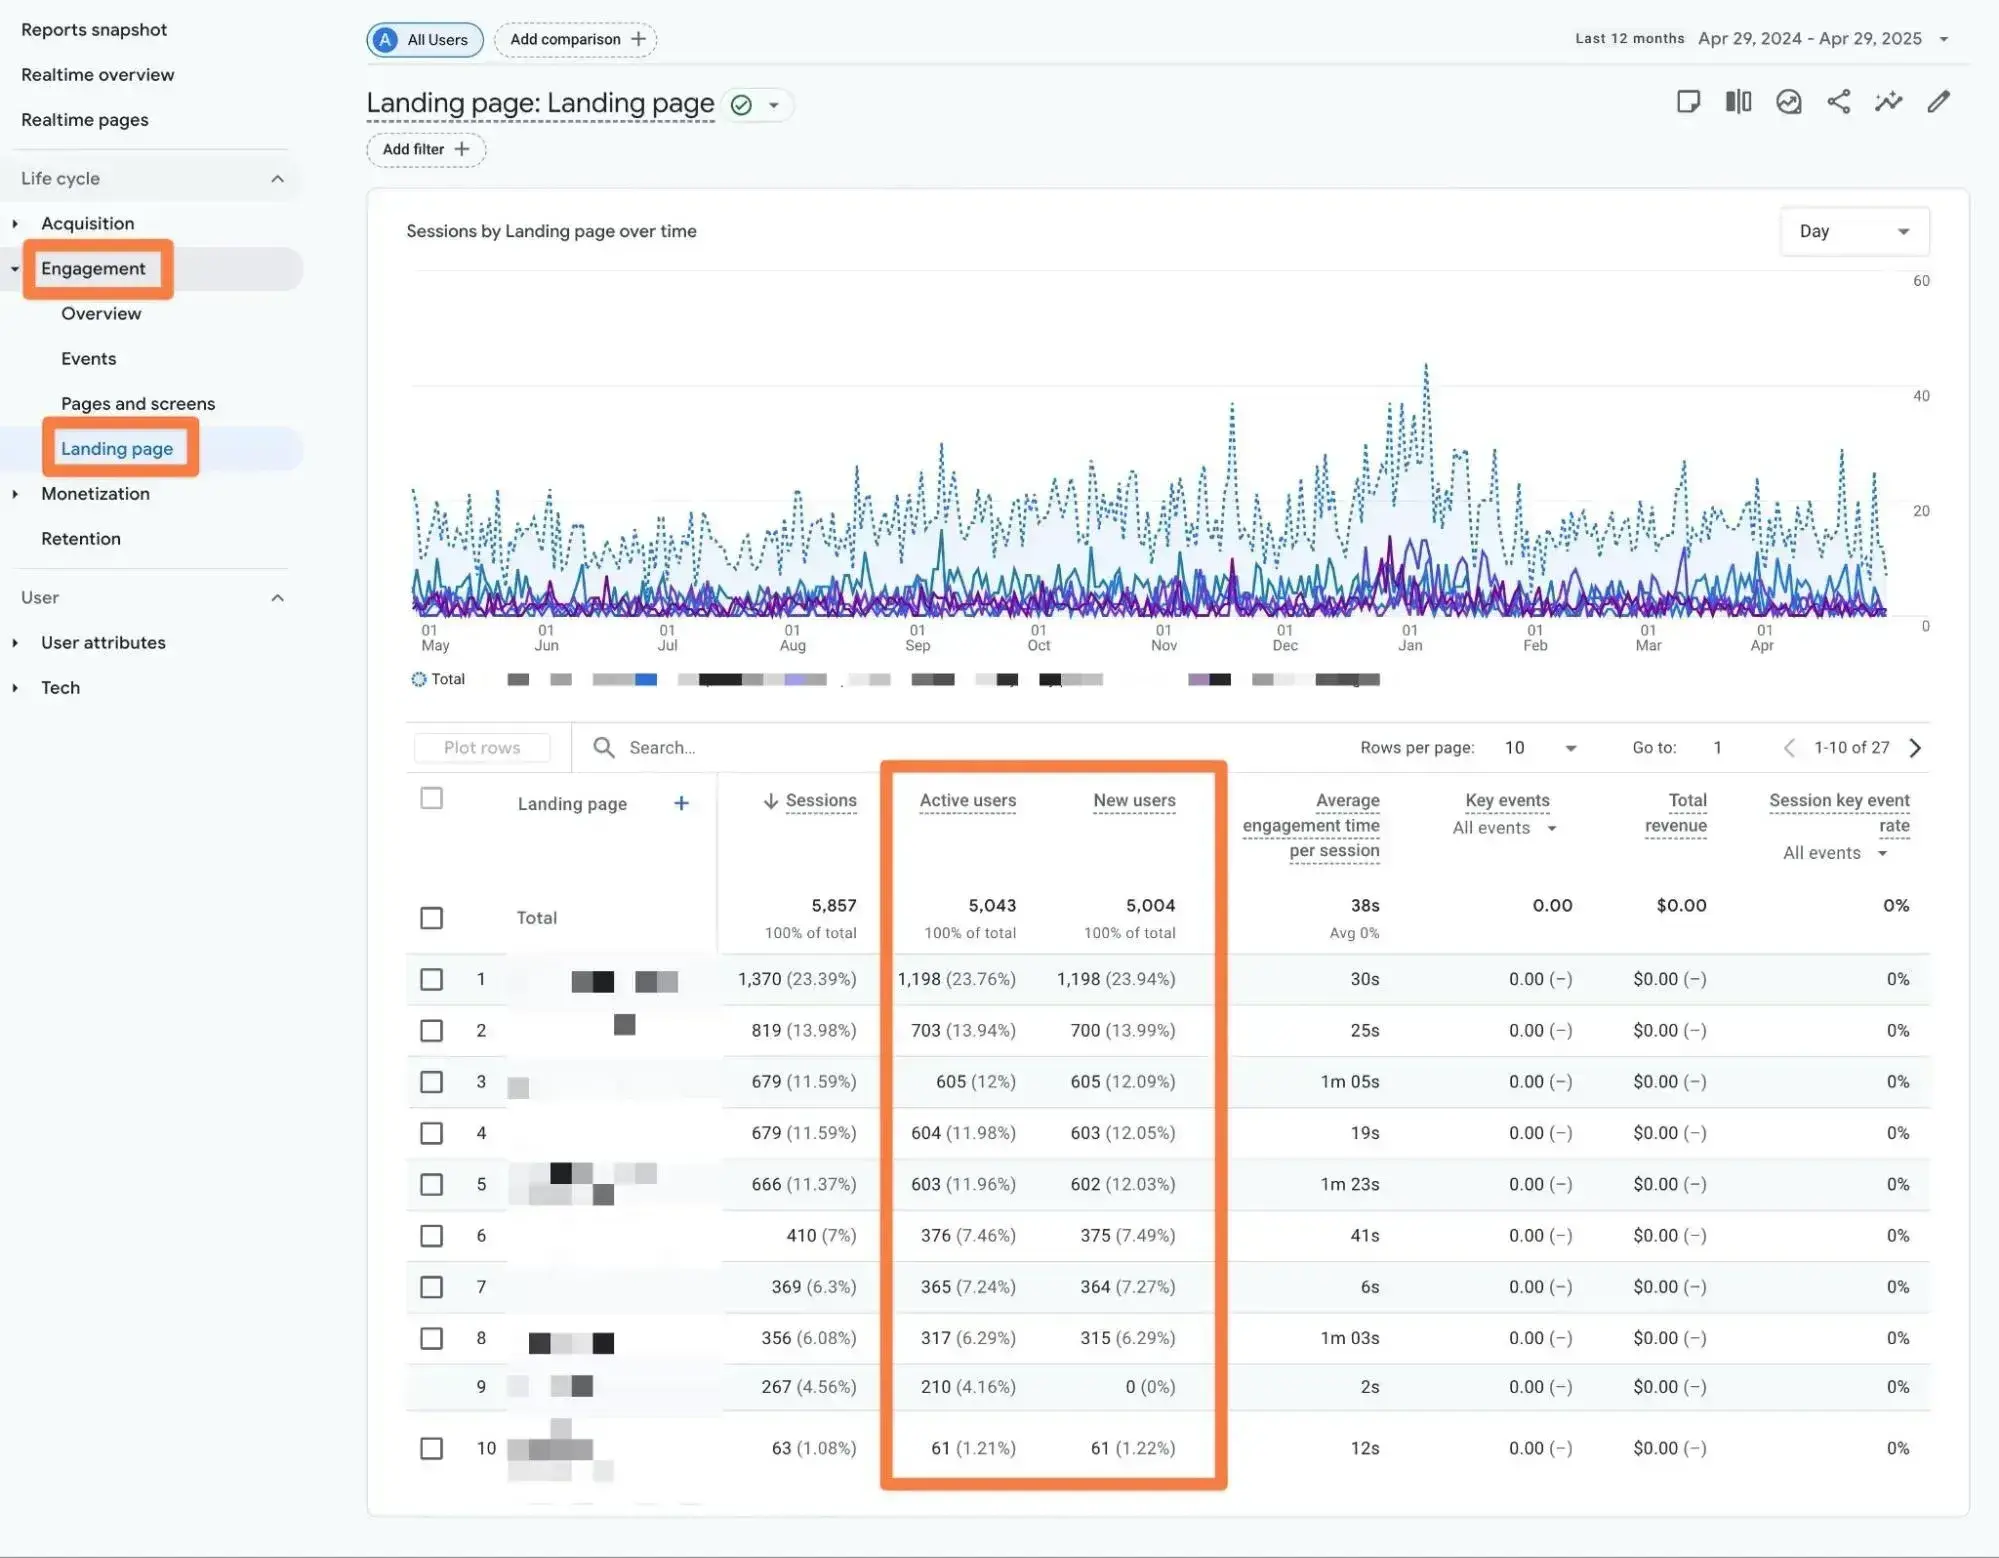
To view Active users and Views, you can go to Reports → Engagement → Pages and screens.
All of these metrics track the same basic idea: how popular a piece of content is. However, each metric comes at the question in a slightly different way, which can give you valuable insights into content performance.
For example, if a piece of content has a lot of users and views, but a low proportion of new users, that could signal that the content resonates with your current audience, but isn’t effectively helping you connect with a new audience.
On the other hand, if a piece of content has a lower number of views but a very high proportion of new visitors, that could signal that the content is effectively drawing in a new audience, which could help you reach new customers and leads.
Even if the overall view numbers aren’t as impressive, the fact that it’s helping you reach new visitors could still make that type of content worth the investment.
Bounce Rate and Engaged Sessions
A piece of content’s bounce rate helps you track whether or not users find your content engaging and helpful.
The exact definition of bounce rate will depend on the analytics tool that you’re using.
In many tools, including HubSpot Analytics and the now-deprecated Universal Analytics version of Google Analytics, bounce rate is defined as the percentage of single-page sessions (i.e., the percentage of visitors who navigated away from a page without viewing a second page on your site).
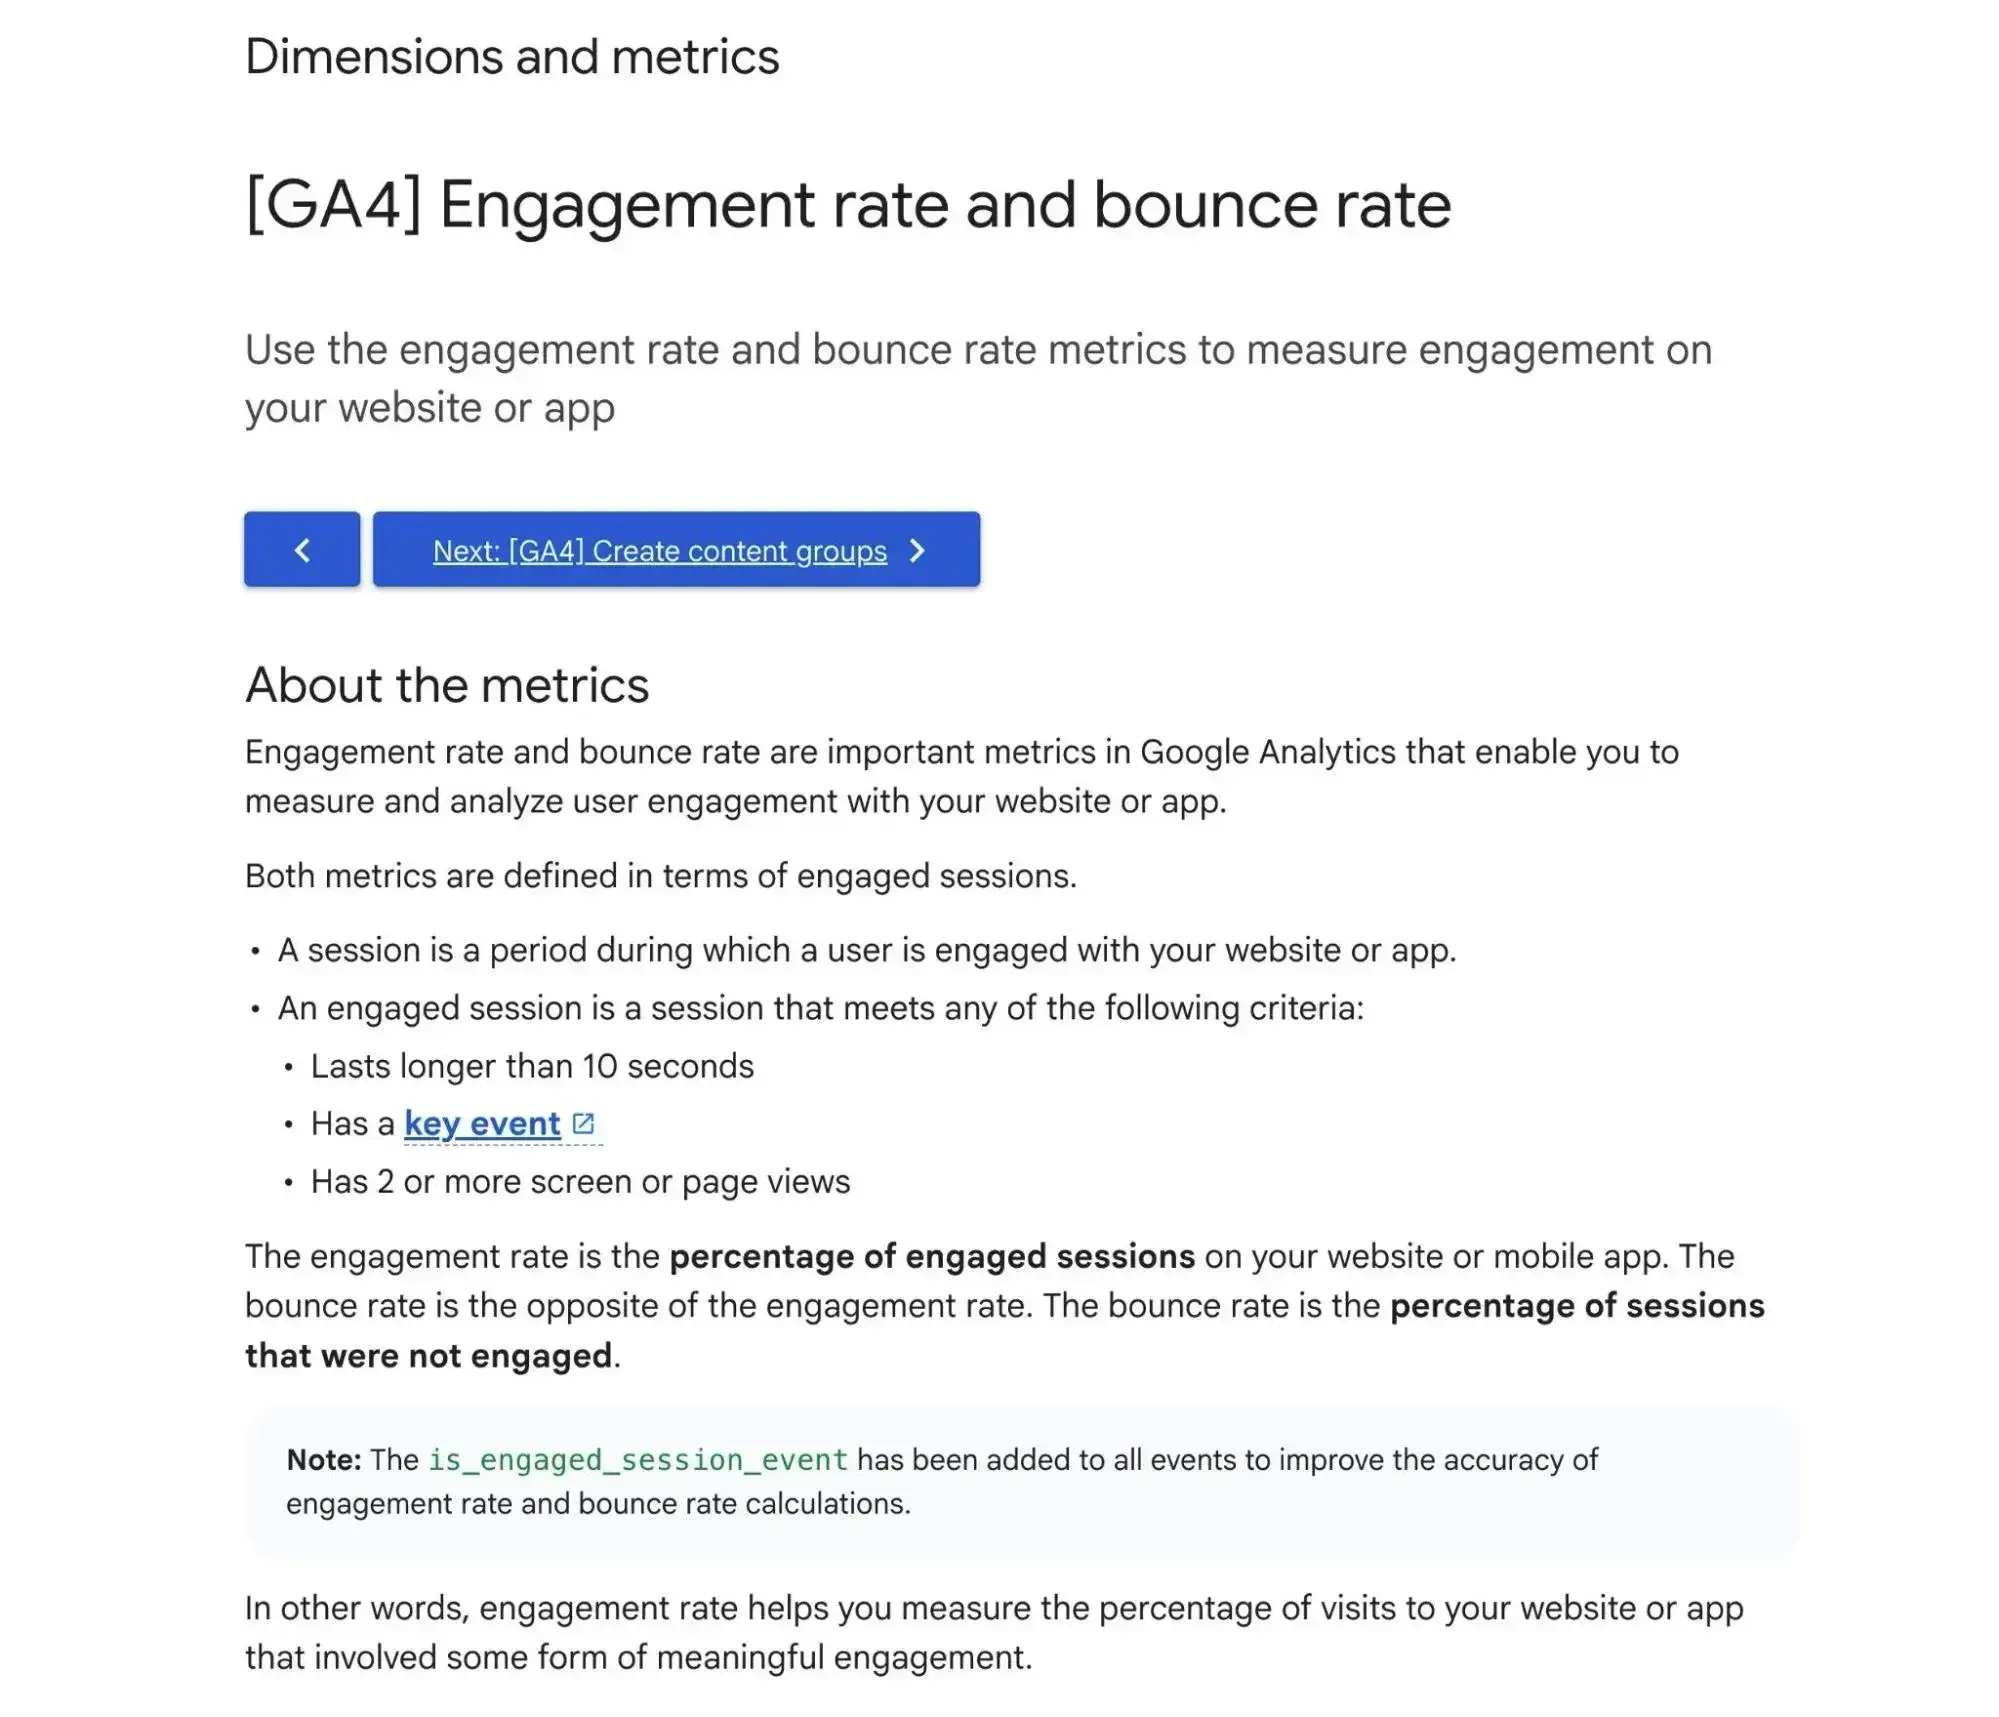
However, in Google Analytics 4 (GA4), bounce rate is defined as the percentage of non-engaged sessions on your site. Google defines an engaged session in GA4 as a session that meets any of the following criteria:
- Lasts longer than 10 seconds.
- Has a key event.
- Has two or more screen or page views.
Regardless of which bounce rate definition you’re using, the basic idea is that a high bounce rate can often (but not always) indicate that users don’t find that piece of content engaging.
When you conduct a content performance analysis, you’ll generally want to prioritize important pages with a high bounce rate when choosing what content to improve.
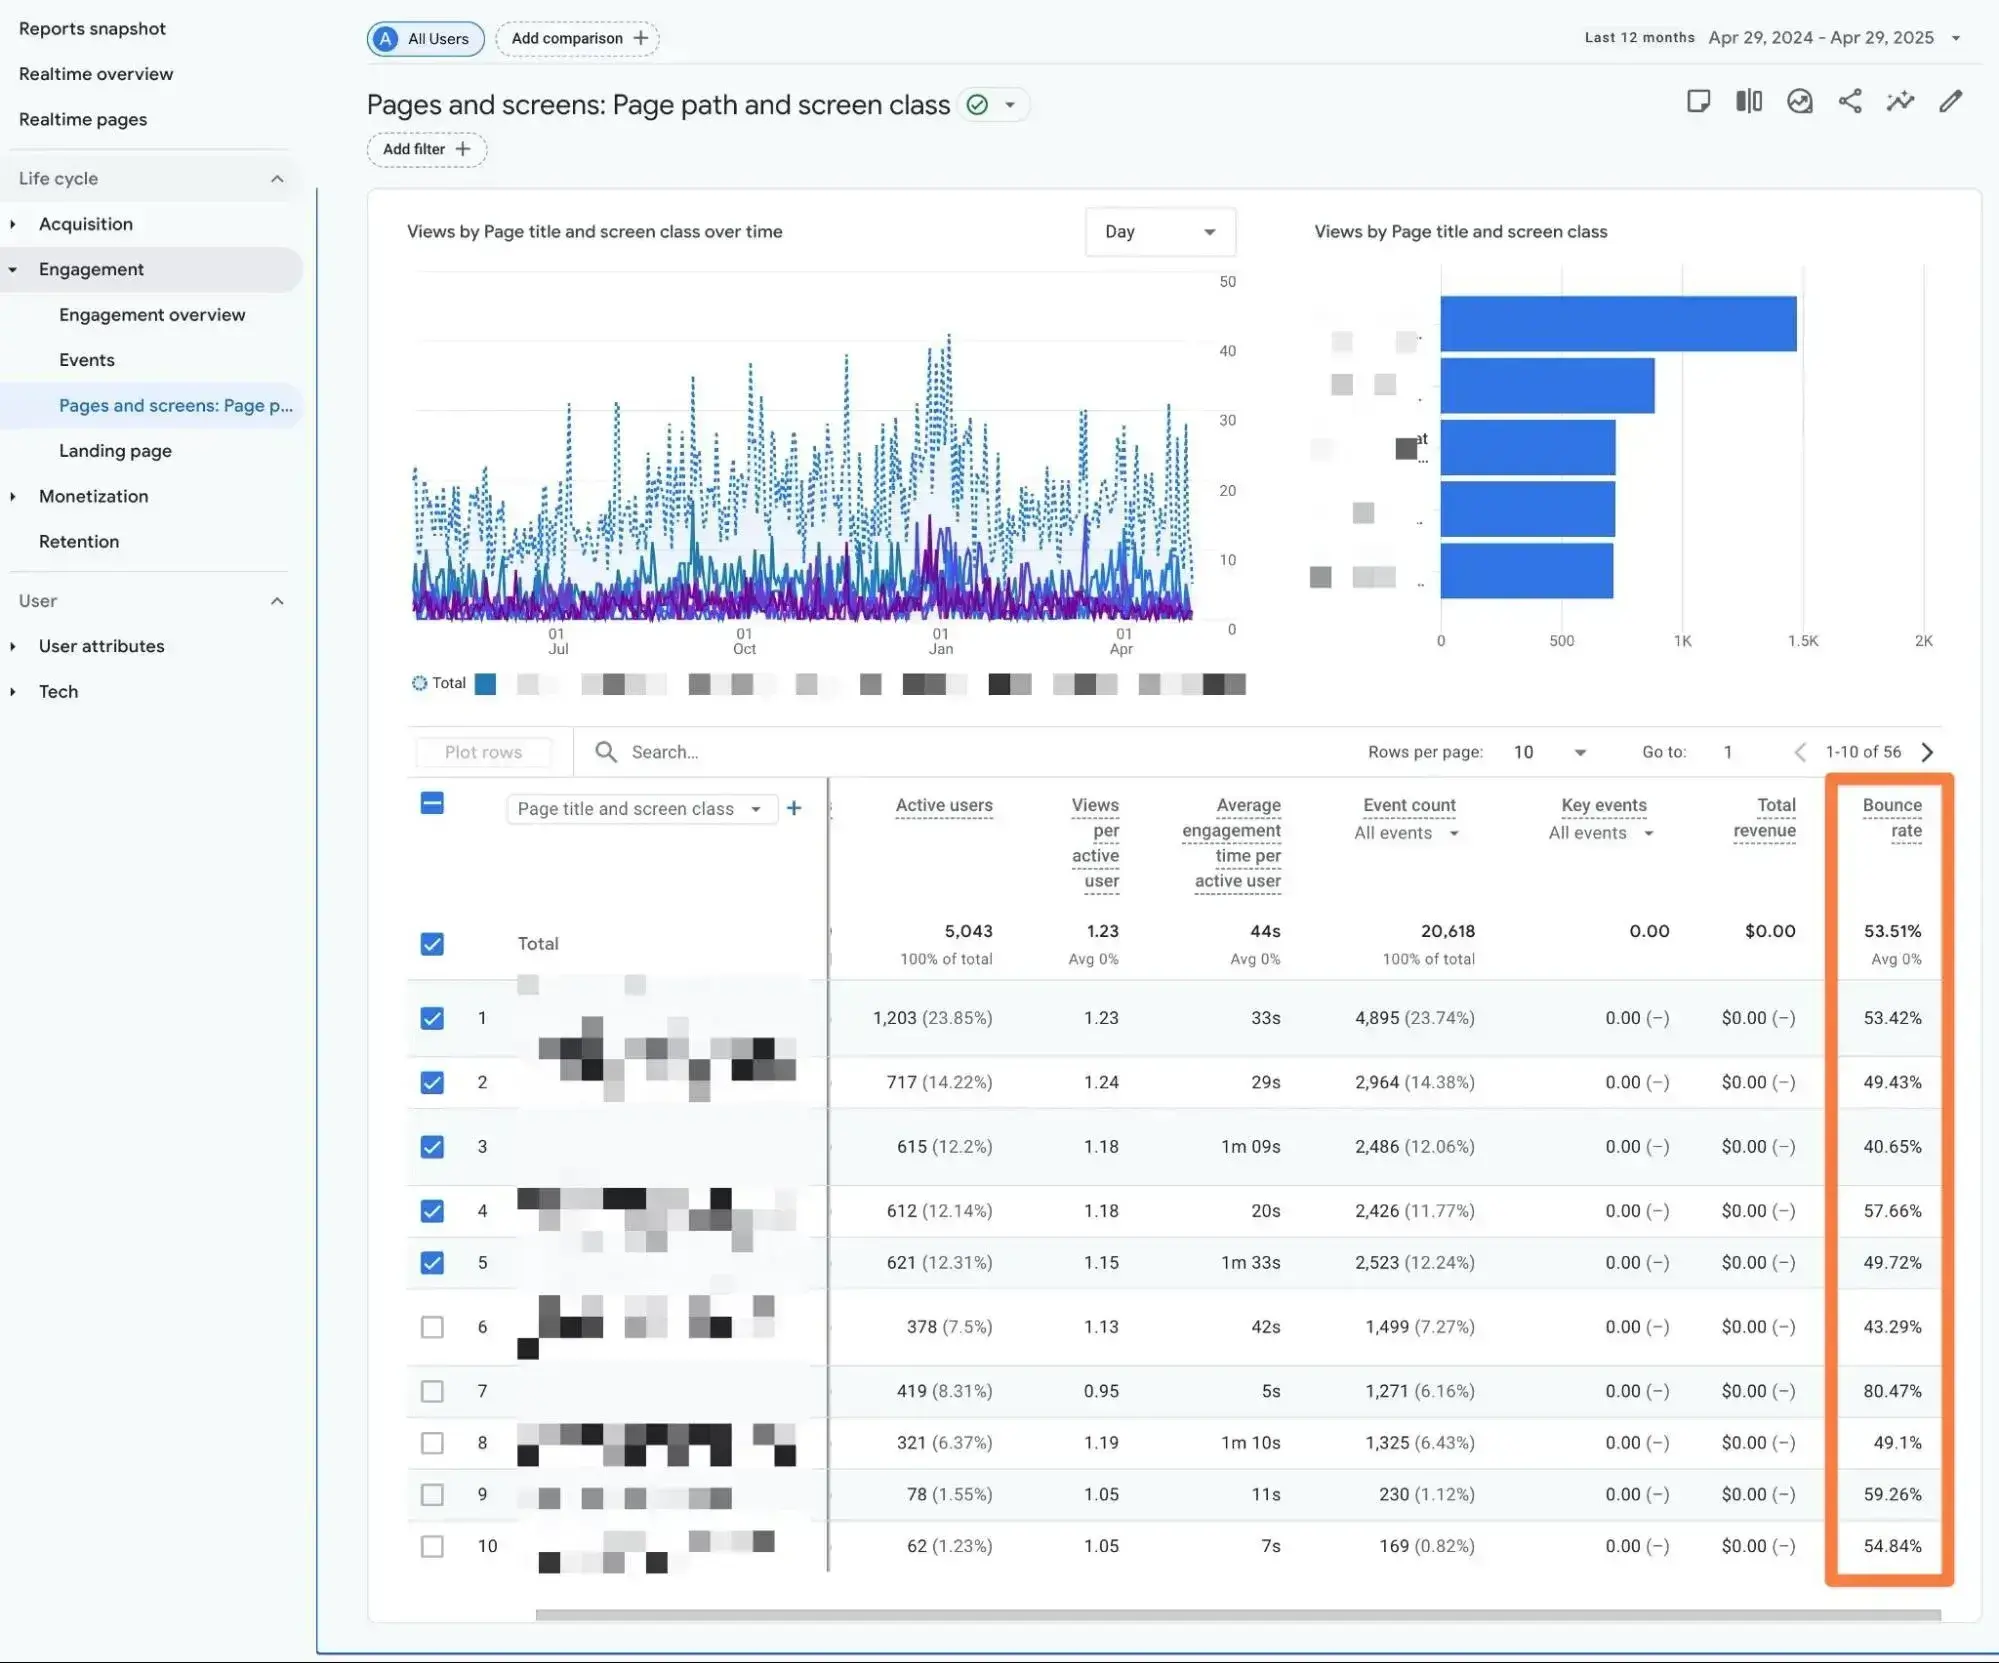
To view bounce rate in GA4, you’ll need to follow these steps to add it to your reports. Once you add it, you’ll be able to see the bounce rate as a column like the example below.
Pro tip: I think it’s important to note that whether or not a high bounce rate is “bad” really depends on the purpose of your page.
For example, if the purpose of the page is to send visitors to an affiliate offer on a third-party website, you would actually want every single visitor to leave your site and go to the affiliate offer, so a high number of single-page sessions might just indicate your page is working well. On the other hand, if visitors are just clicking the “back” button, that wouldn’t be a good thing.
To understand which situation applies to your page, you would also need to look at some of the other metrics that I’ll cover, such as conversions.
Time on Page and Average Engagement Time
Time on page, called average engagement time in GA4, measures how long users are engaging and interacting with a page on your site.
While the older version of Google Analytics calculated time on page as the time in between page views, GA4 calculates it as the average time that your page was in the foreground of users’ browsers. That is, the time that users are actively looking at your website, rather than just having it open as a background tab.
In GA4, you can see this metric by going to Reports → Engagement → Pages and screens or Landing page and looking at the Average engagement time per active user or session column.
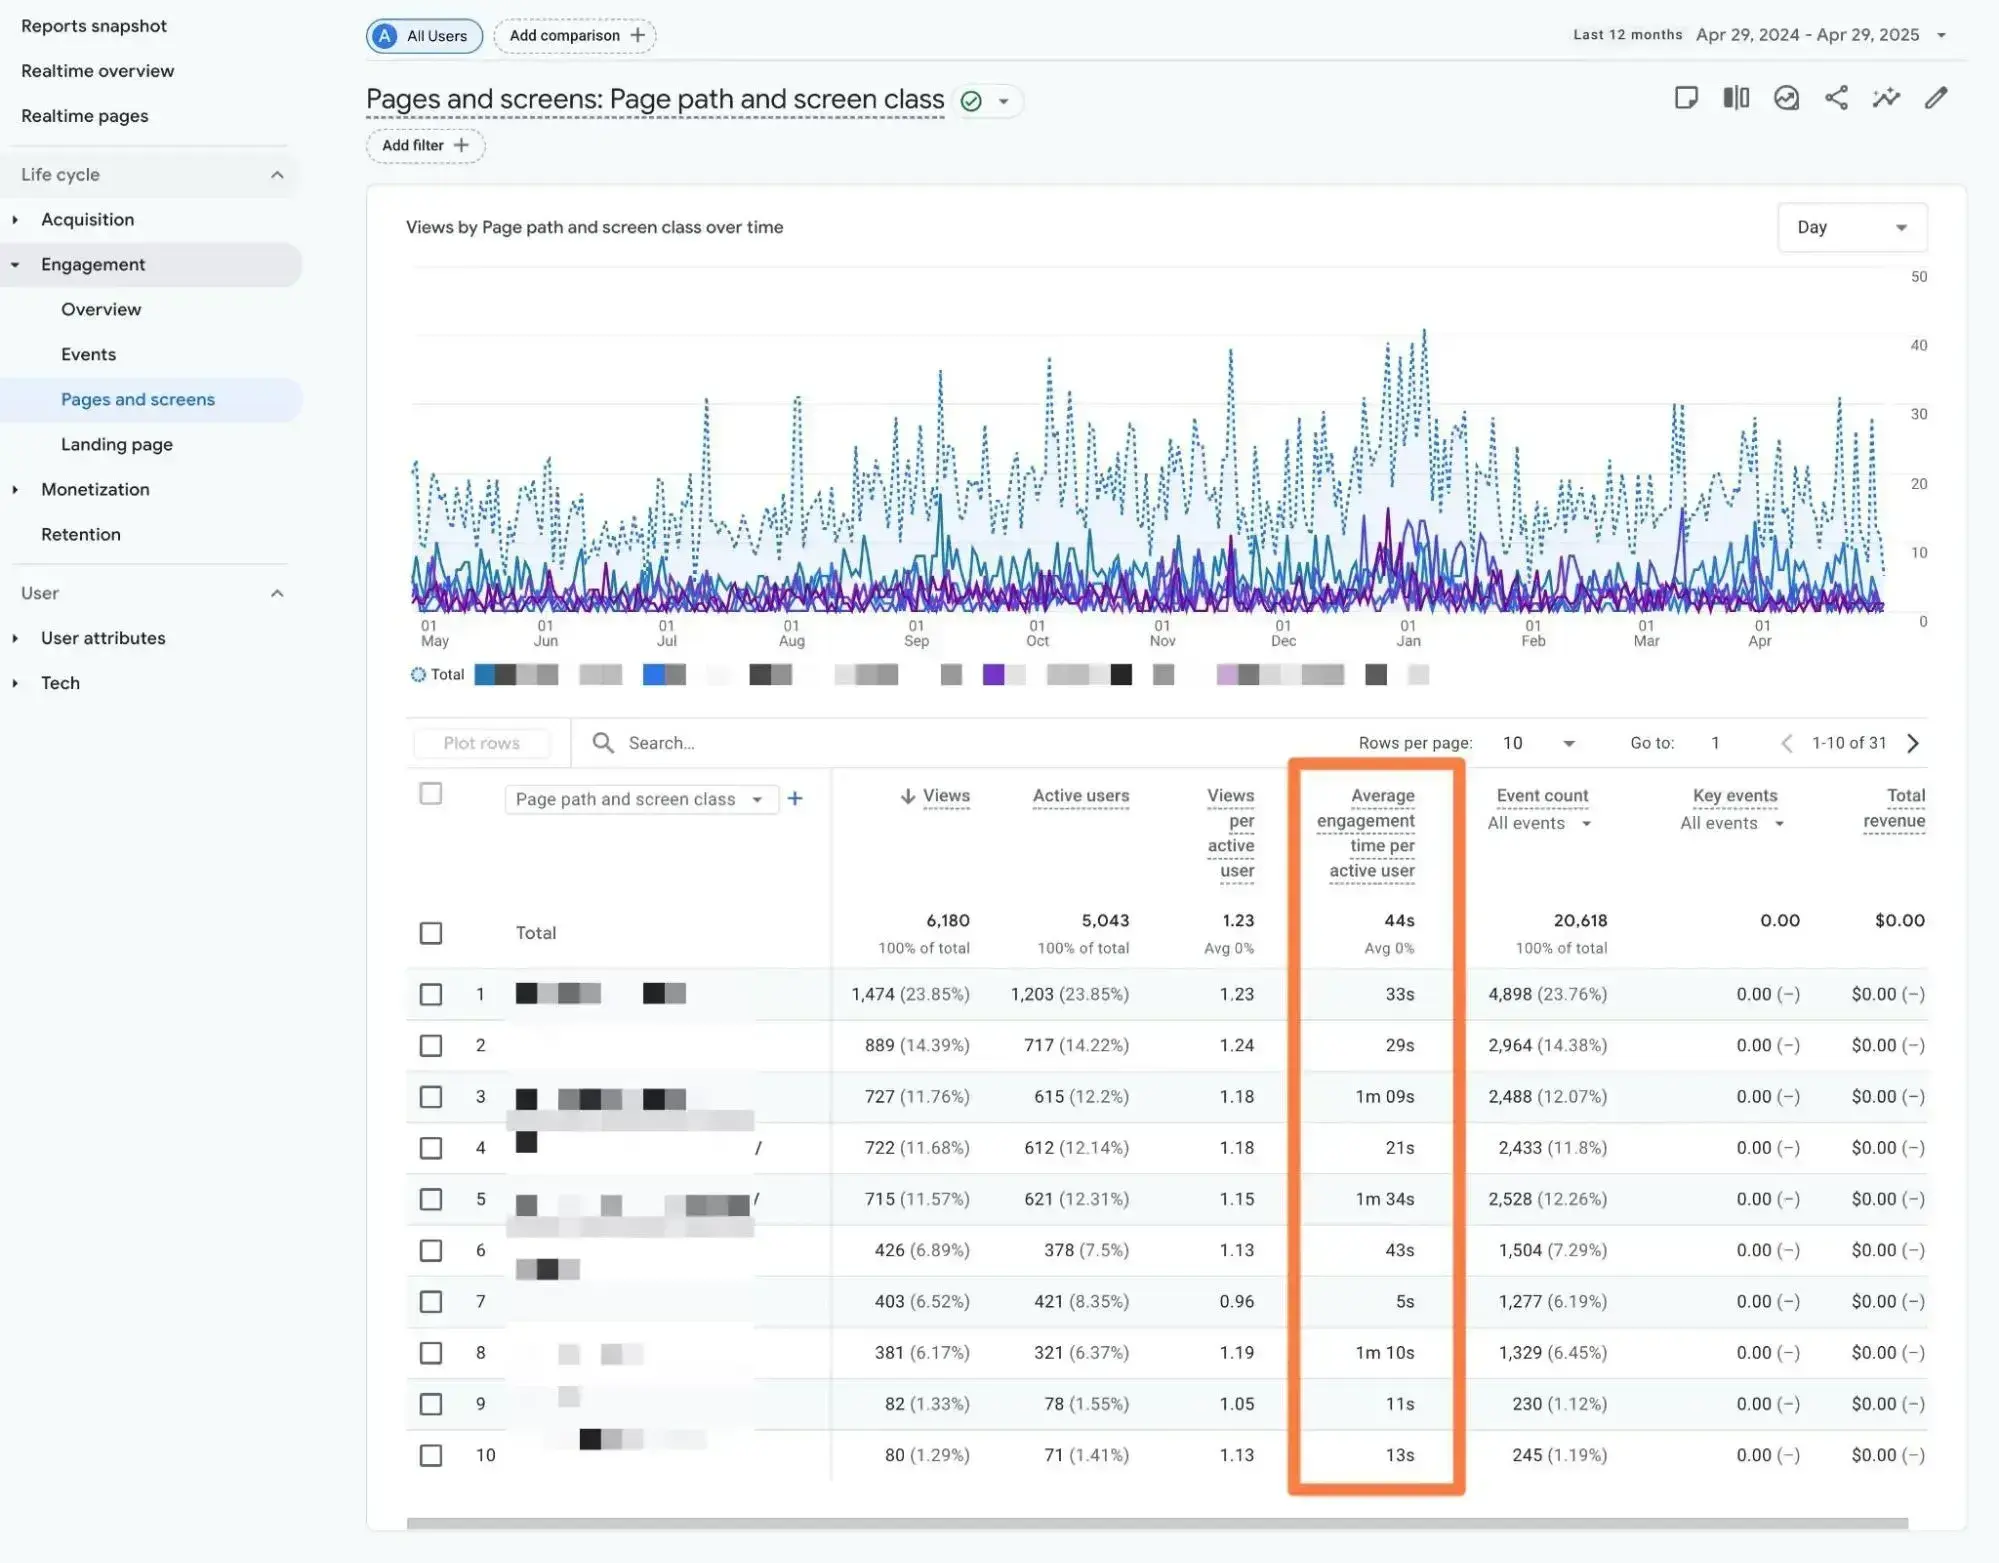
As a general rule, a higher average engagement time means that visitors find your content interesting and are taking the time to engage with it.
I don’t think there’s a single “good” time to aim for — it really just depends on the purpose and length of each piece of content. However, it can be really useful as a comparative metric between similar pieces of content.
For example, if you find that one long-form blog post has an average engagement time that’s 3x another, that might be a sign that you need to find ways to improve the content with the lower time.
HubSpot's Free Website Builder
Create and customize your own business website with an easy drag-and-drop website builder.
- Build a website without any coding skills.
- Pre-built themes and templates.
- Built-in marketing tools and features.
- And more!
Dwell Time
Dwell time is defined as how long the user spends on a page after clicking through from a search engine results page (SERP) and before returning to the search results page.
It’s similar to the concepts of bounce rate and engaged sessions in the previous section, but I think it’s helpful to segment it into its own metric because it’s more focused on helping you assess whether or not the content matches search intent and satisfies searchers:
- A higher dwell time usually means that searchers think your content matches their queries.
- A lower dwell time might indicate some type of mismatch between your content and what people are looking for in Google.
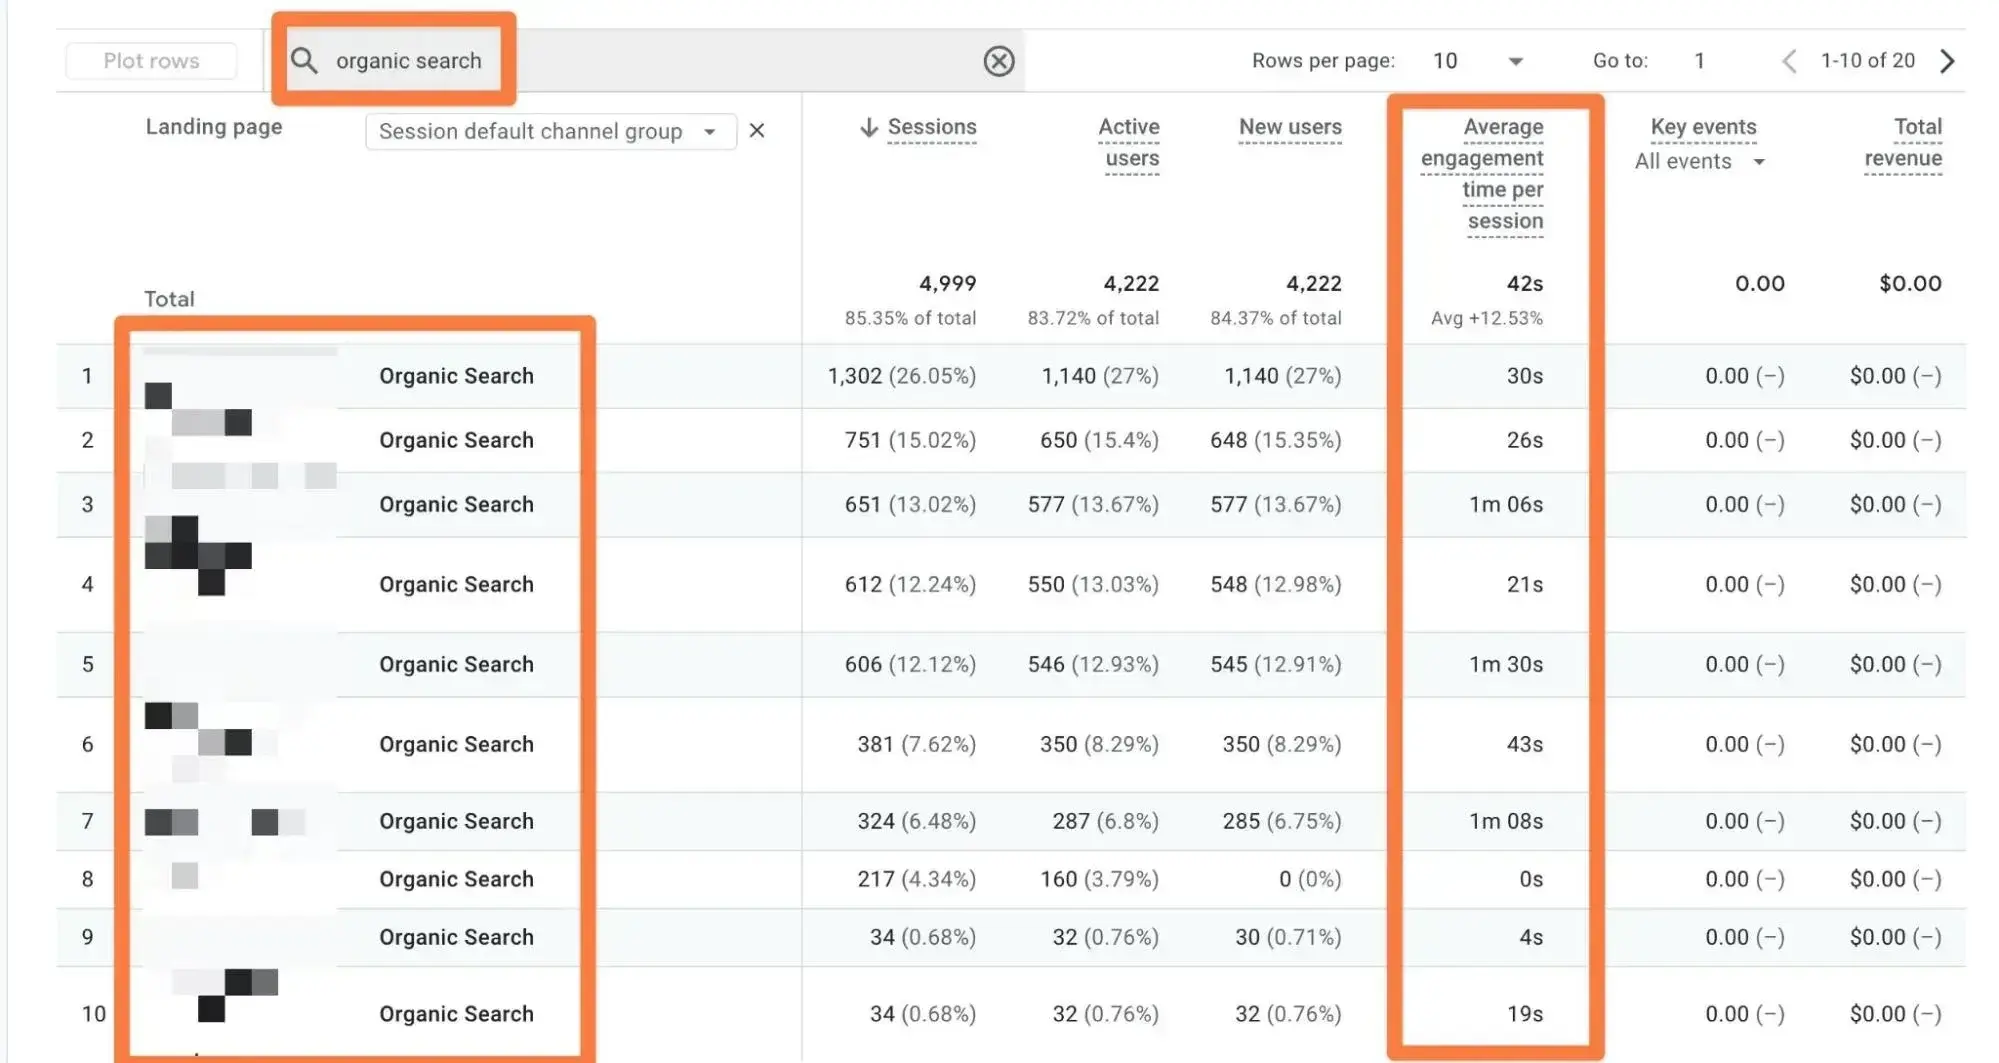
Google Analytics doesn’t have a dedicated dwell time metric, but you can use the “Average engagement time per session” metric as a rough proxy — you just need to specifically look at the “organic search” traffic source.
Here’s how I recommend doing it:
- Go to Reports → Engagement → Landing page in your Google Analytics dashboard.
- Click the plus (+) icon next to Landing page in the first column.
- In the menu that appears, choose Traffic source → Cross-channel → Session default channel group.
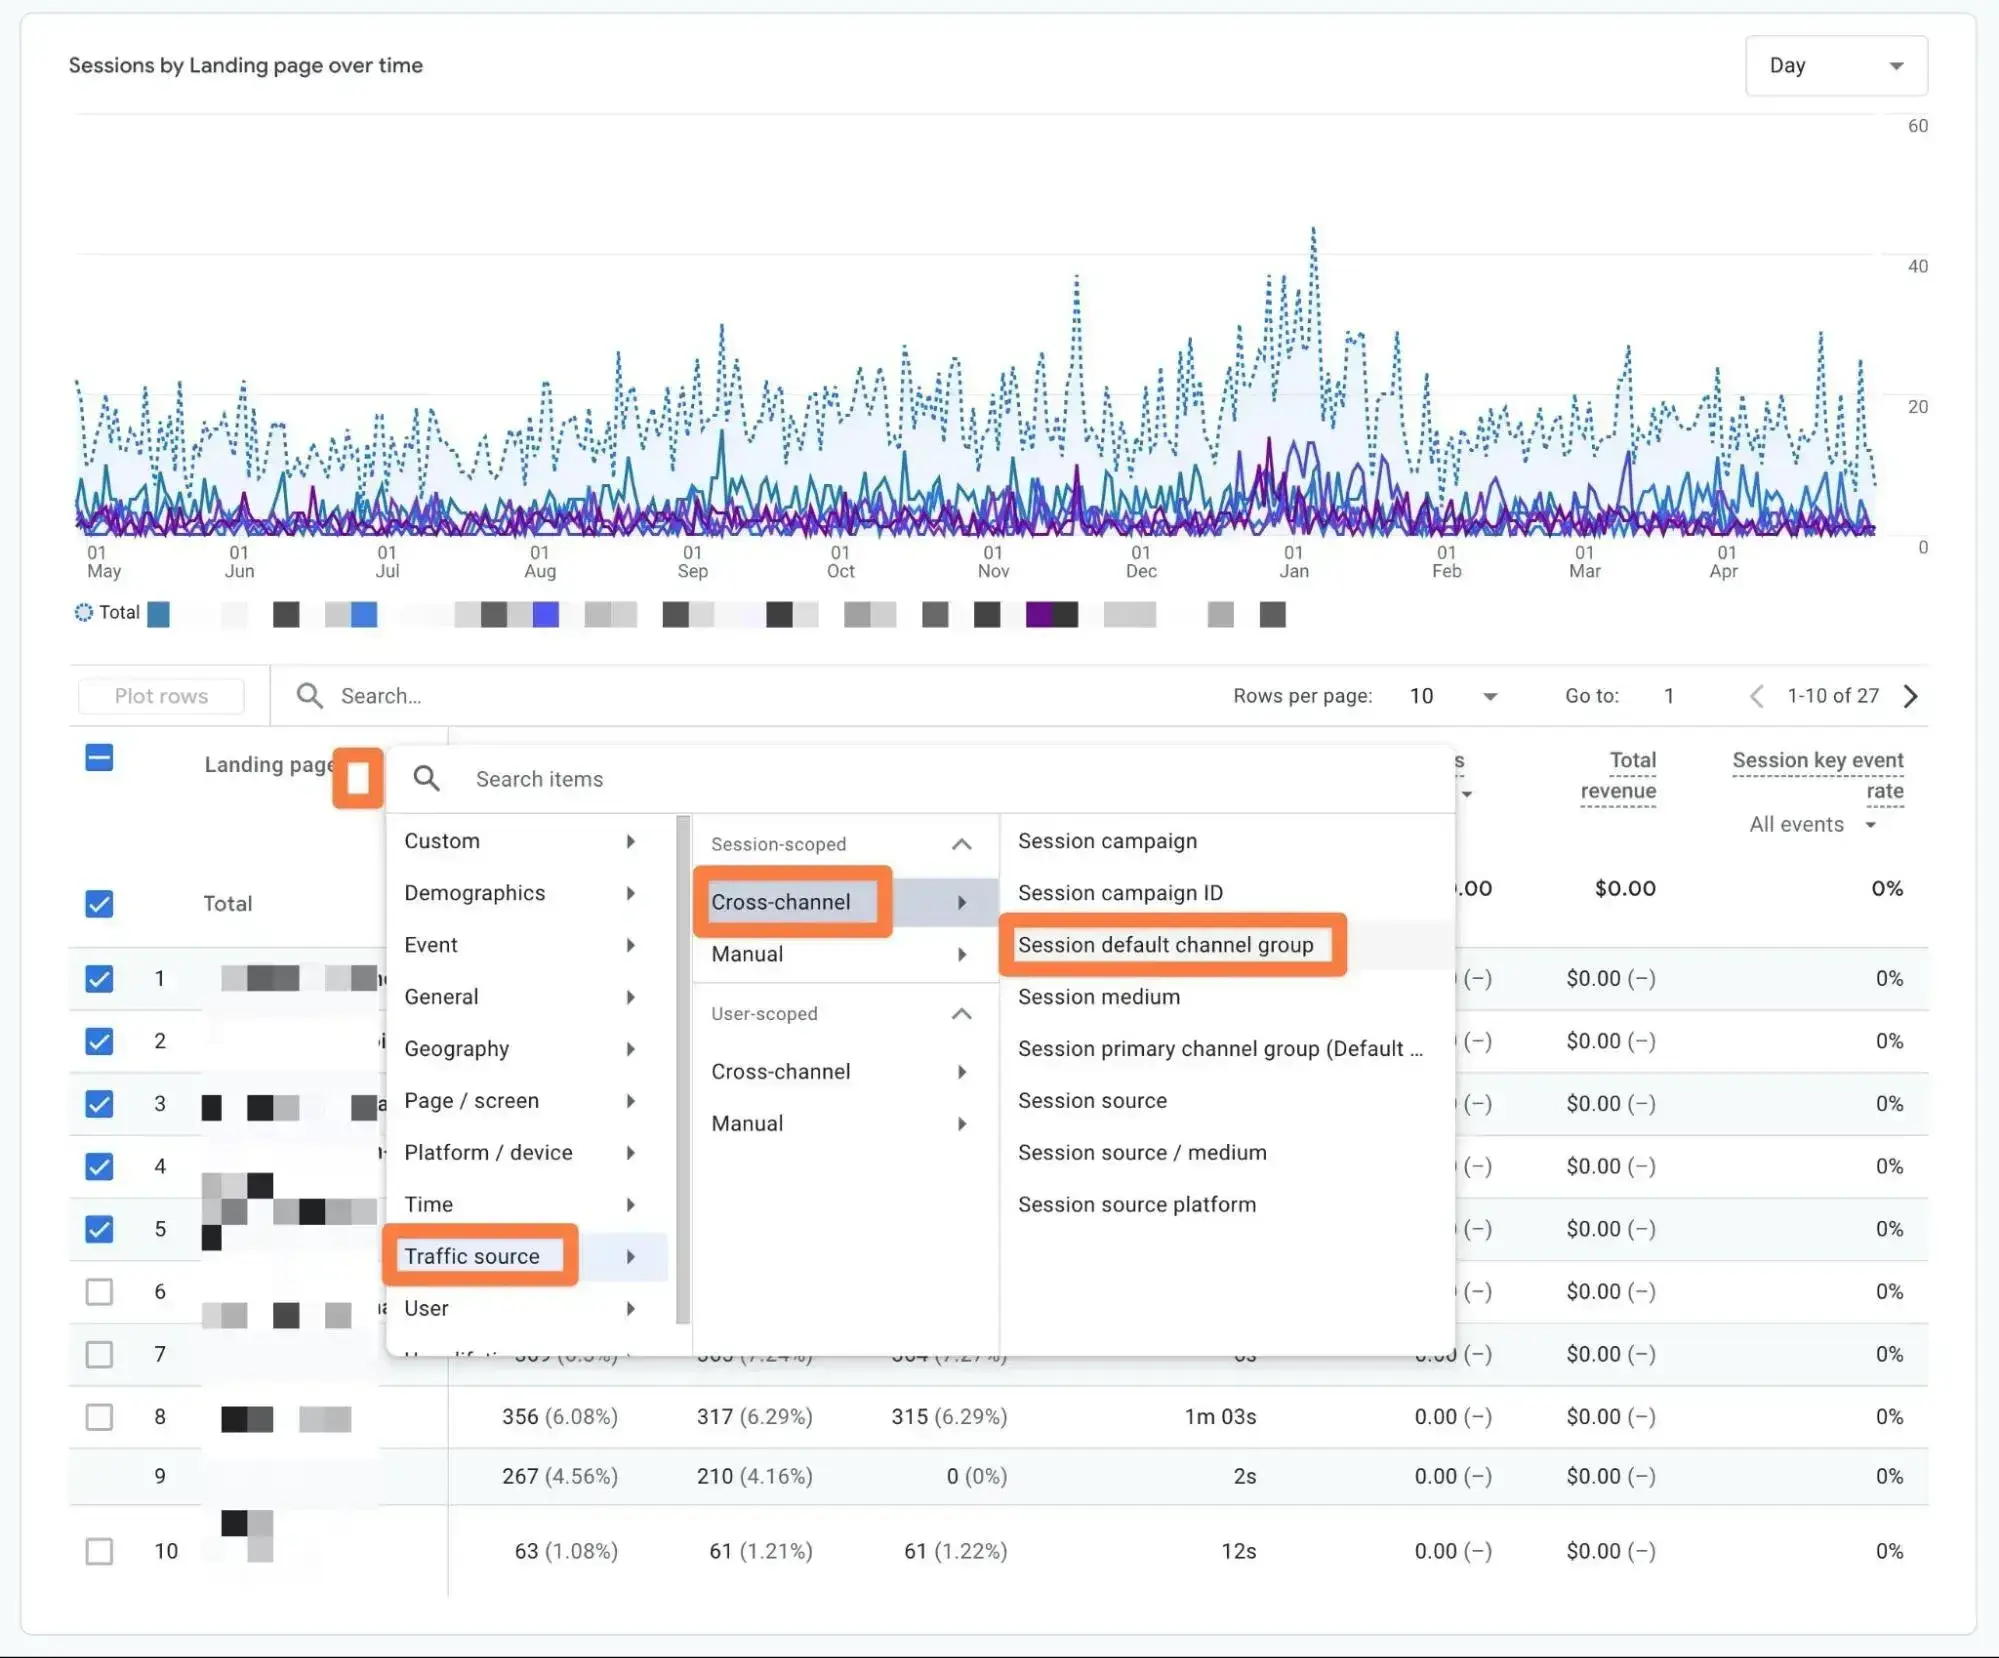
Now, if you type “organic search” into the search box above the data table, you’ll be able to filter out the average engagement time per session metric for traffic from search engines.
Traffic Sources
A page’s traffic source report highlights all the different ways in which users came to that page. For example, whether they came from search engines, social media, email marketing, or paid ads.
One traffic source that I recommend putting a special emphasis on is organic search traffic, as this will let you track the number of visits you’re earning from search engines like Google.
To see traffic sources in Google Analytics, you can go to Reports → Acquisition → Traffic acquisition or User acquisition.
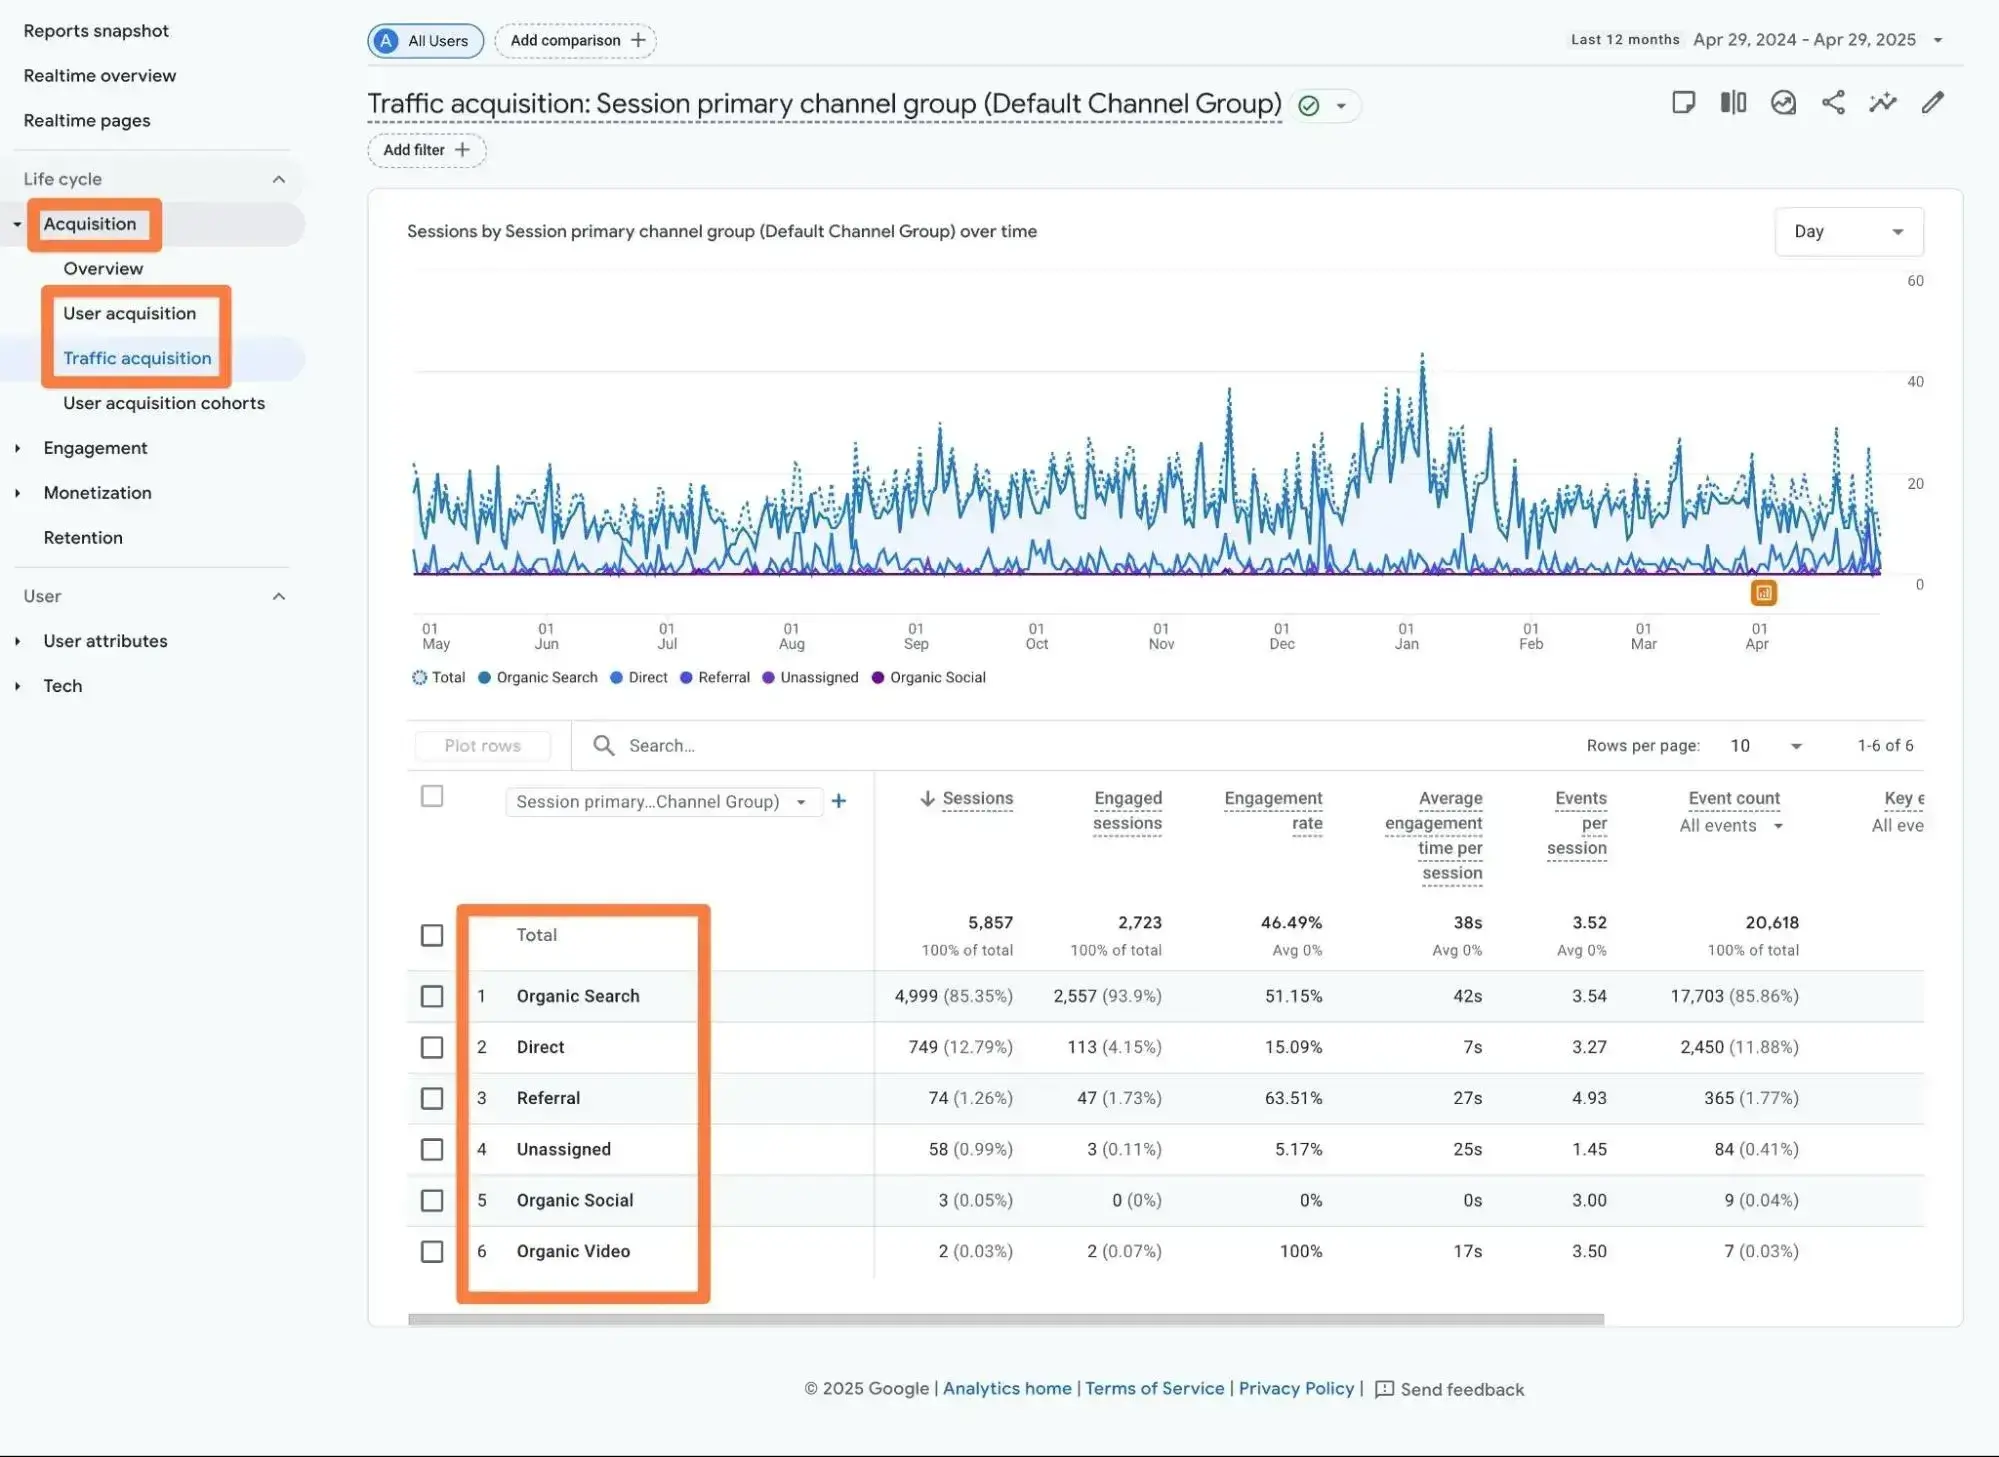
These reports will give you the numbers for your site as a whole.
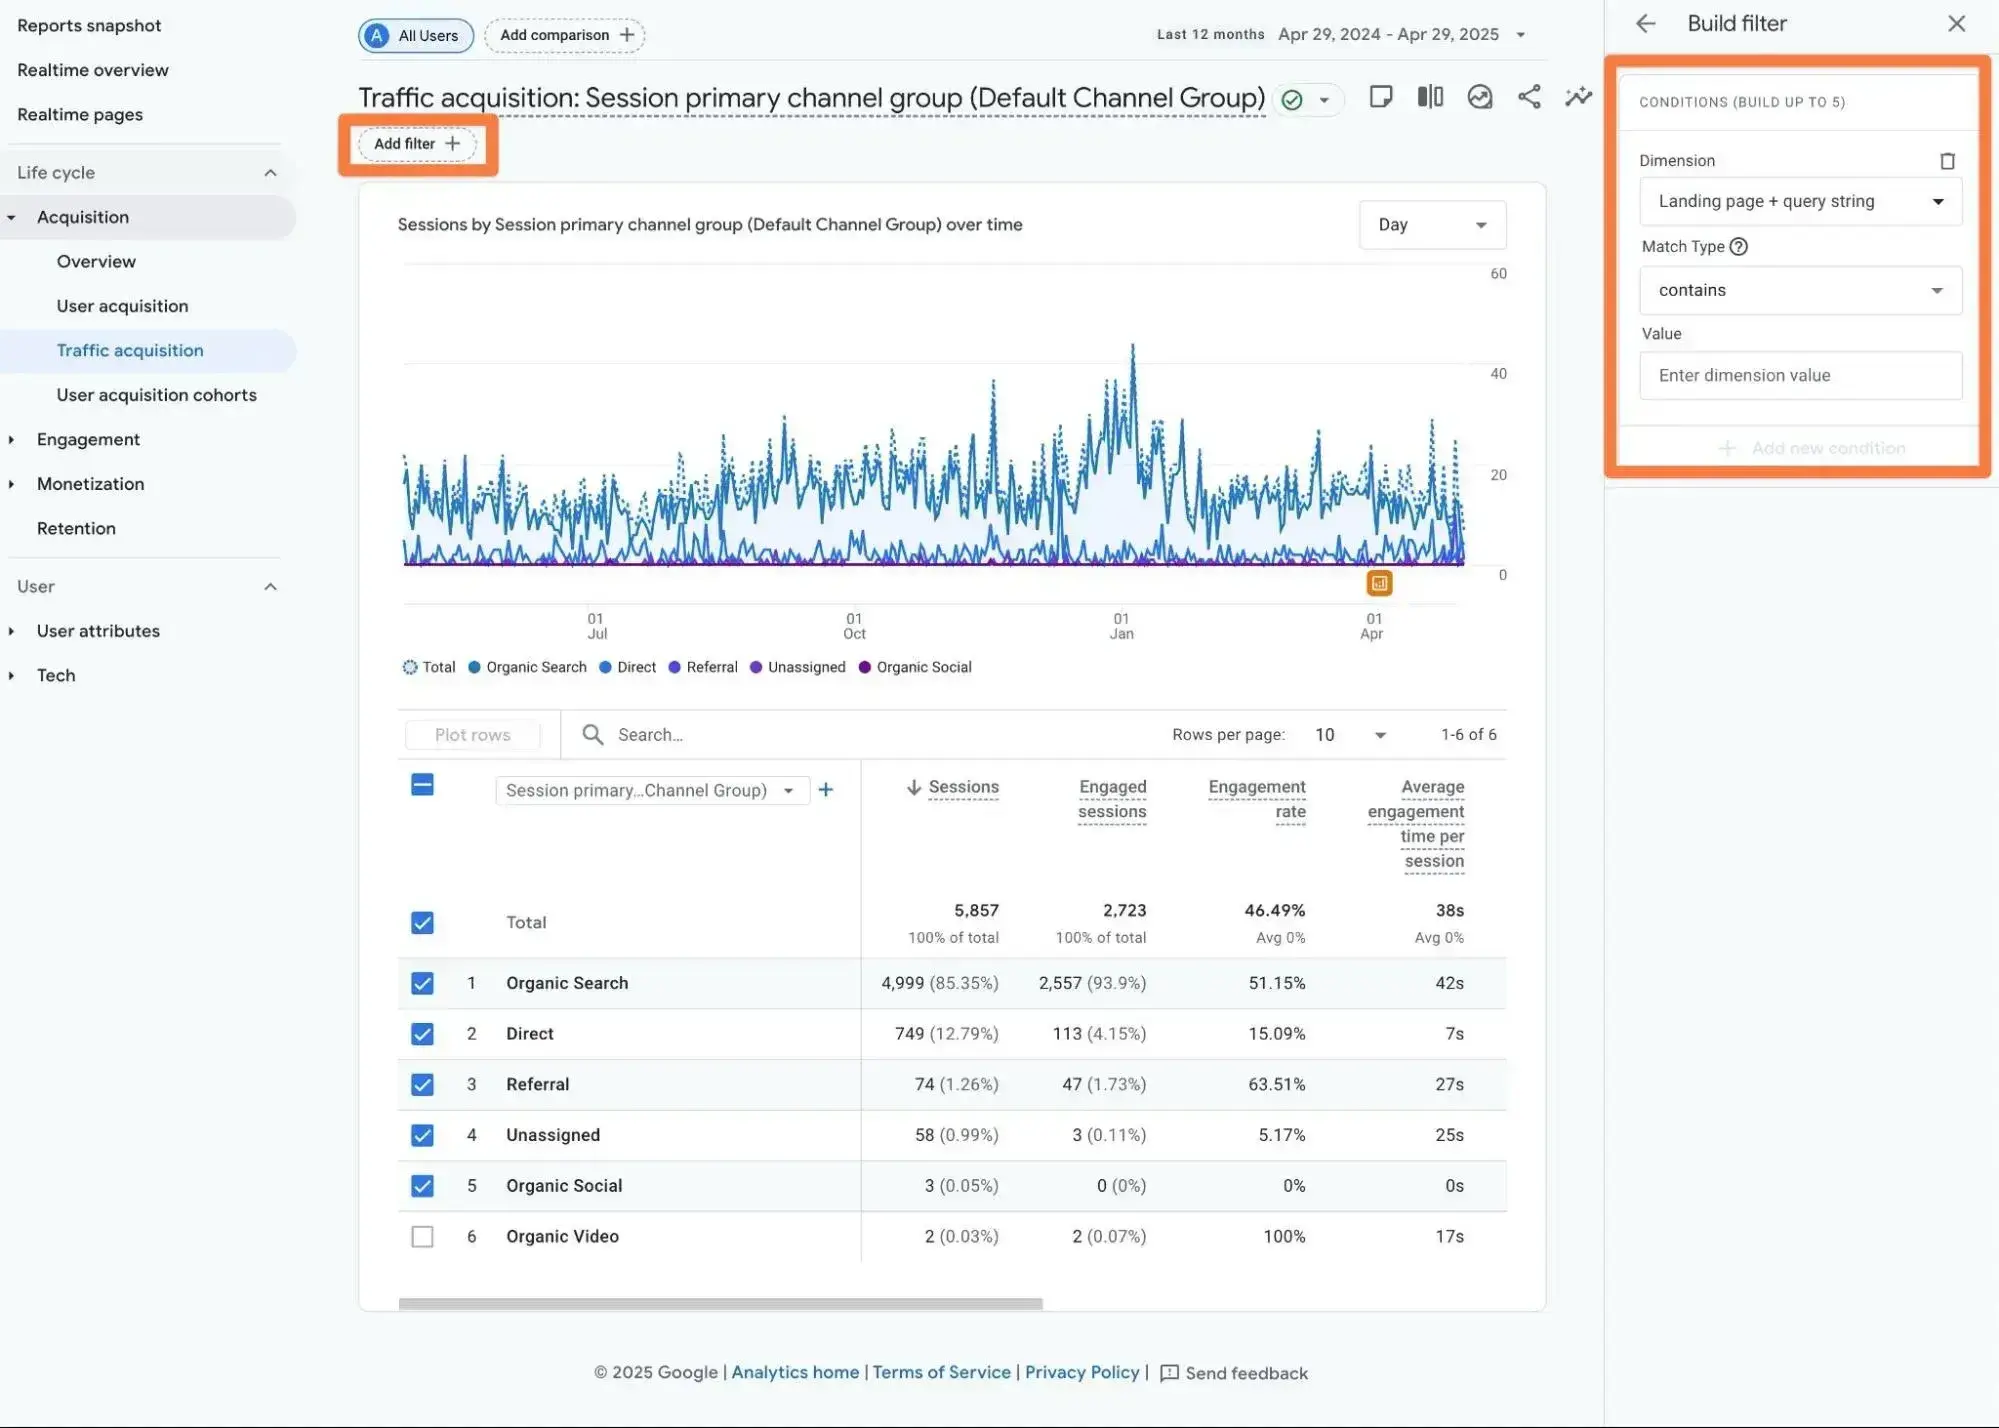
If you want to see the traffic sources for an individual page, you can add a filter to the page. Click the Add filter button at the top to create a filter.
Then, select Landing page + query string as the dimension and choose contains or exactly matches the URL slug of the page, depending on how specific you want to be. This will update the report to show data for only that page.
SEO and AI Visibility Metrics
Keyword Rankings in Search Engines
Tracking keyword rankings is another essential part of performing a content performance analysis. Essentially, you want to be able to track your site’s ranking positions in Google and other search engines for important keywords.
There are tons of great third-party keyword rank tracking tools that you can consider, and I do use these as part of my own content analysis stack.
However, you can also get accurate data straight from Google — for free! All you need to do is set up your site with Google Search Console, which will let you track the average rankings for individual pages and keywords on your site.
While Google Search Console is really handy by itself, I personally prefer enhancing it by using an additional tool like SEOcrawl or SEOTesting.
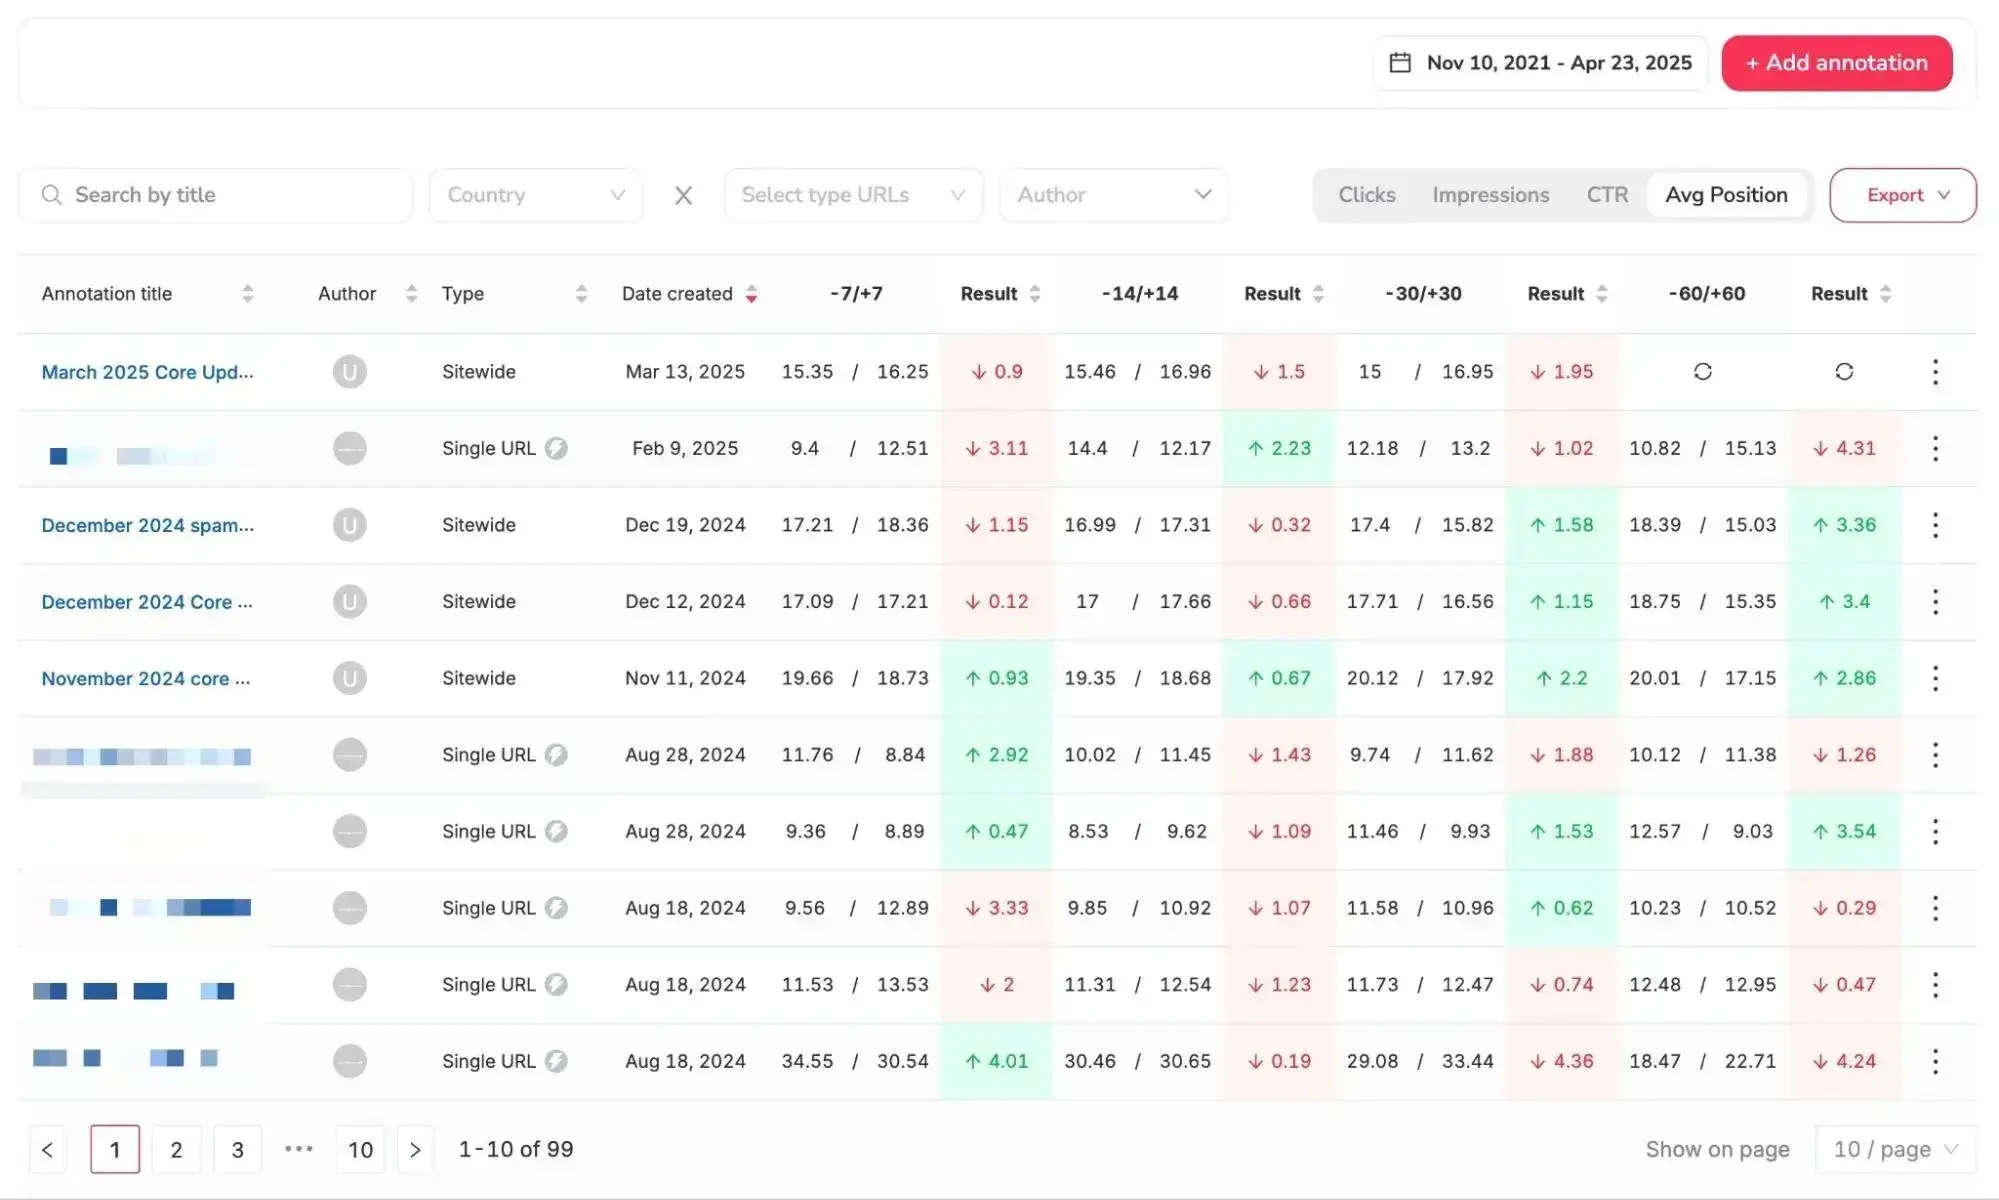
Essentially, these tools let you sync all of your Google Search Console data and then add some extra helpful options. For example, SEOcrawl lets me add annotations when I change a page (such as refreshing/updating content). This lets me easily see how rankings have moved before/after I made the change.
I use a mix of third-party rank tracking tools, Google Search Console (directly), and SEOcrawl. They all have their own advantages, so I like just using a bit of everything.
Other Keyword Performance Metrics (Impressions, Clicks, and CTR)
While I put a lot of emphasis on tracking the keyword rankings of your content, I think that the other keyword performance metrics in Google Search Console can also be useful for analyzing content performance.
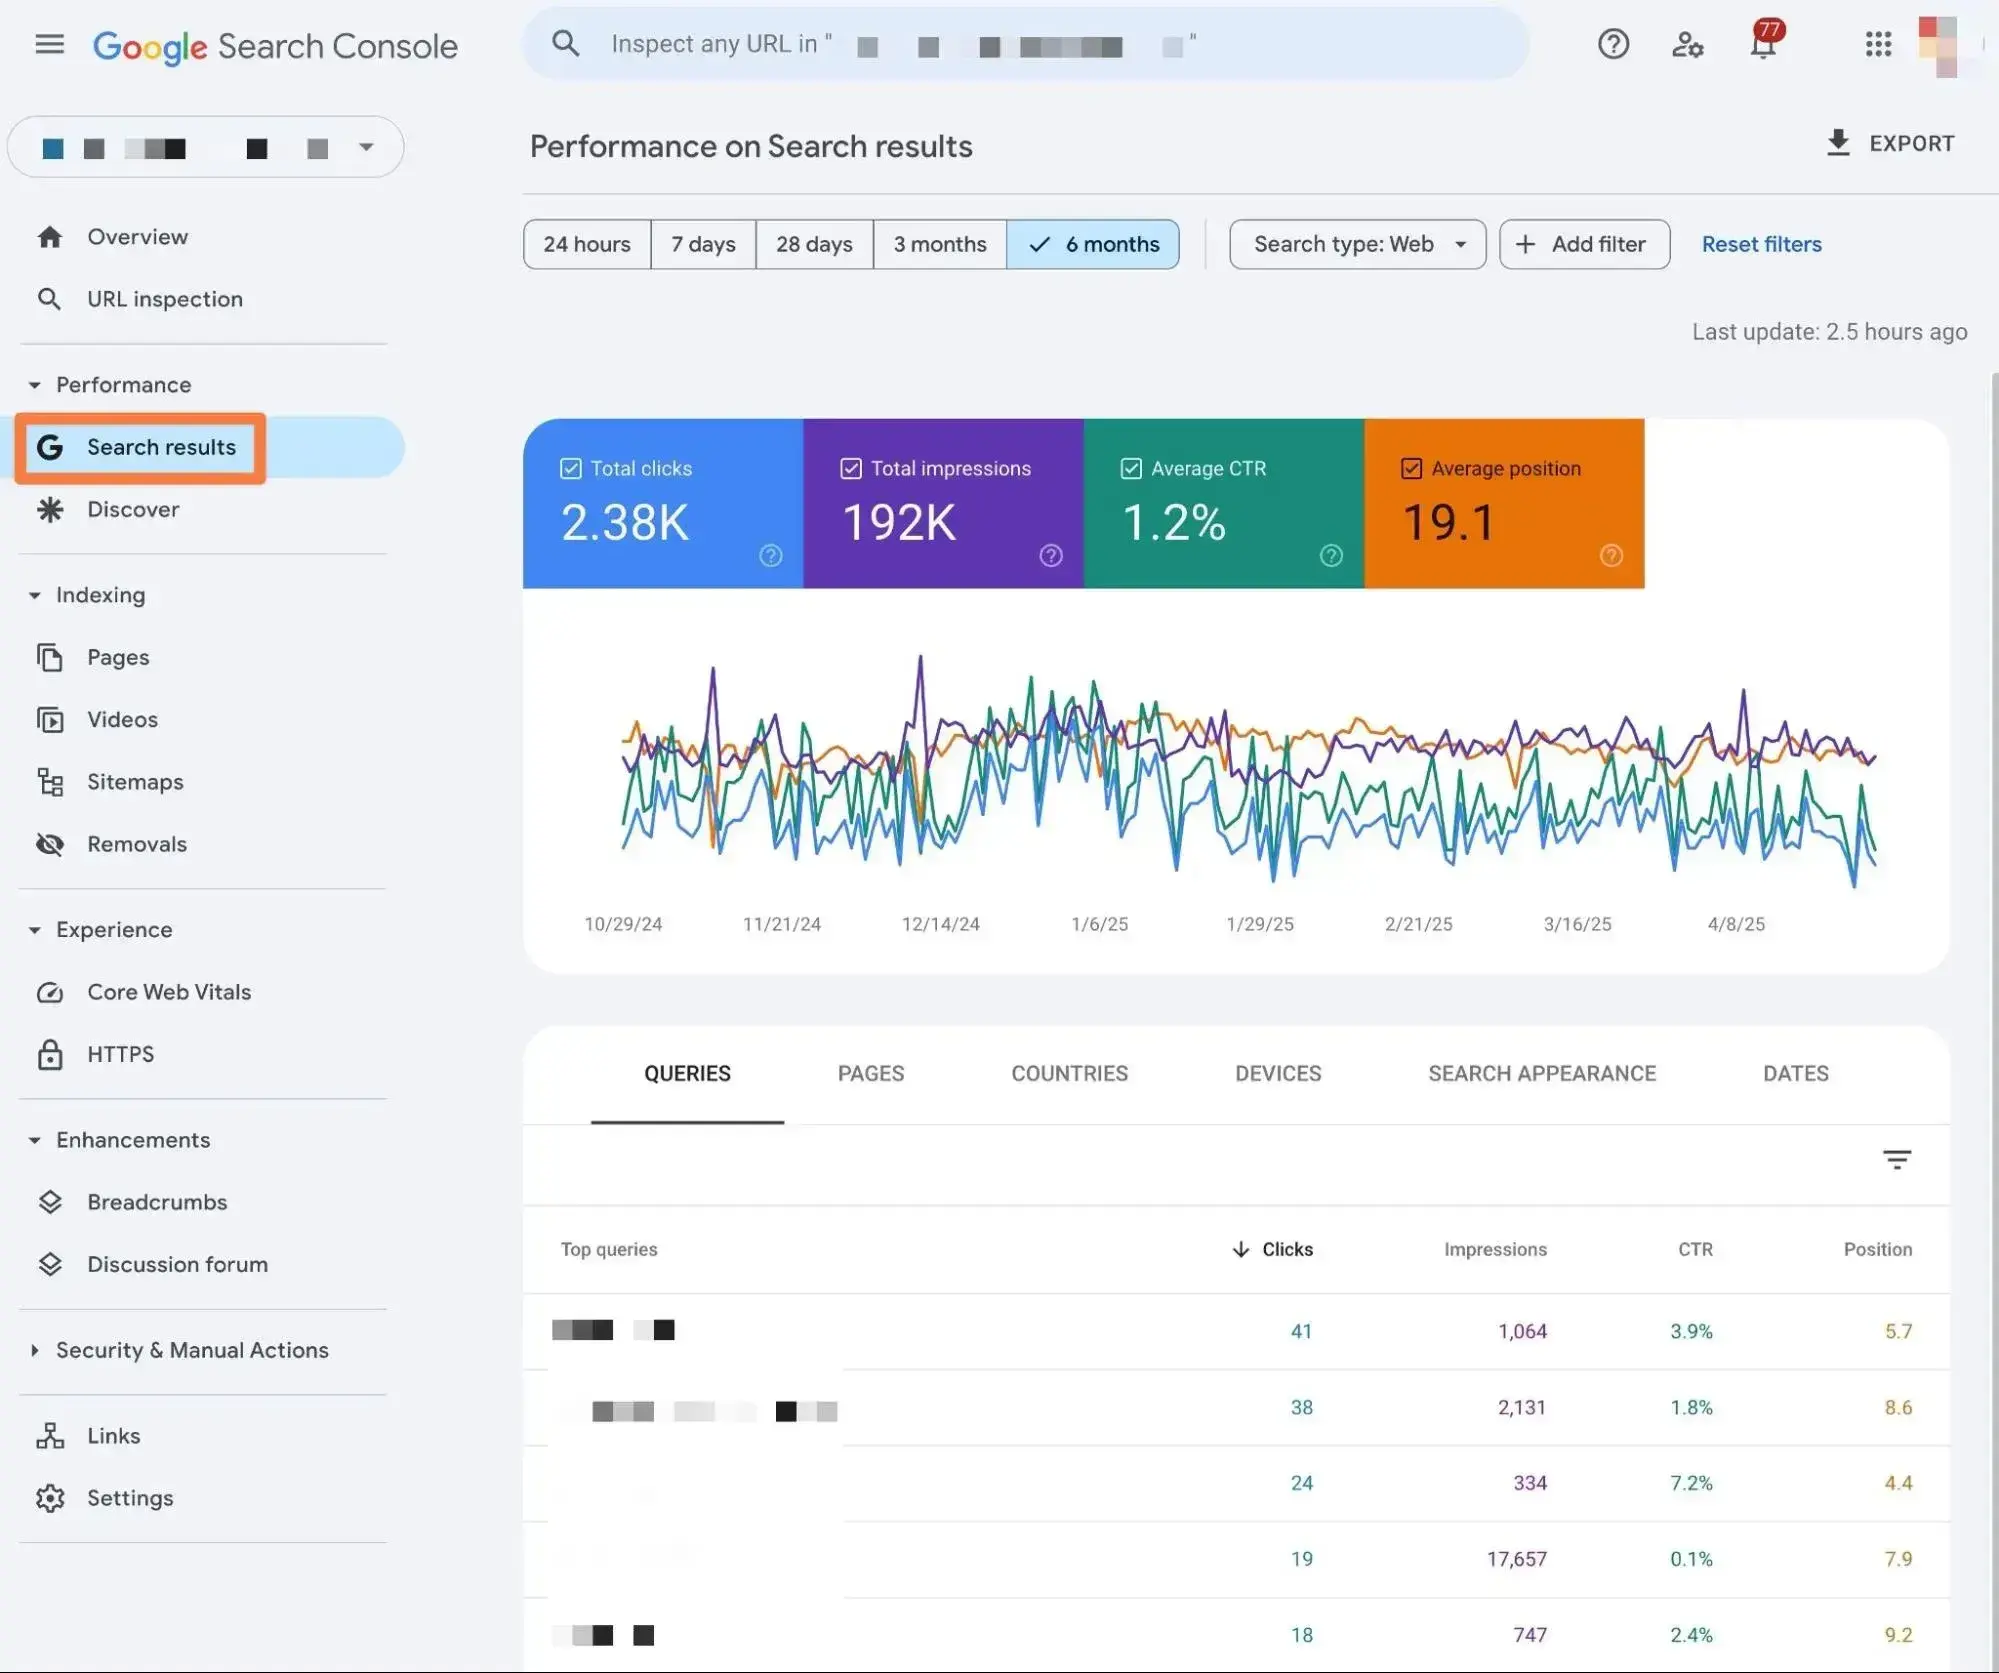
Beyond the average keyword ranking position, Google Search Console also gives you three other metrics:
- Impressions. This is the number of people who saw your website in search results.
- Clicks. This is the number of people who clicked on your website in search results.
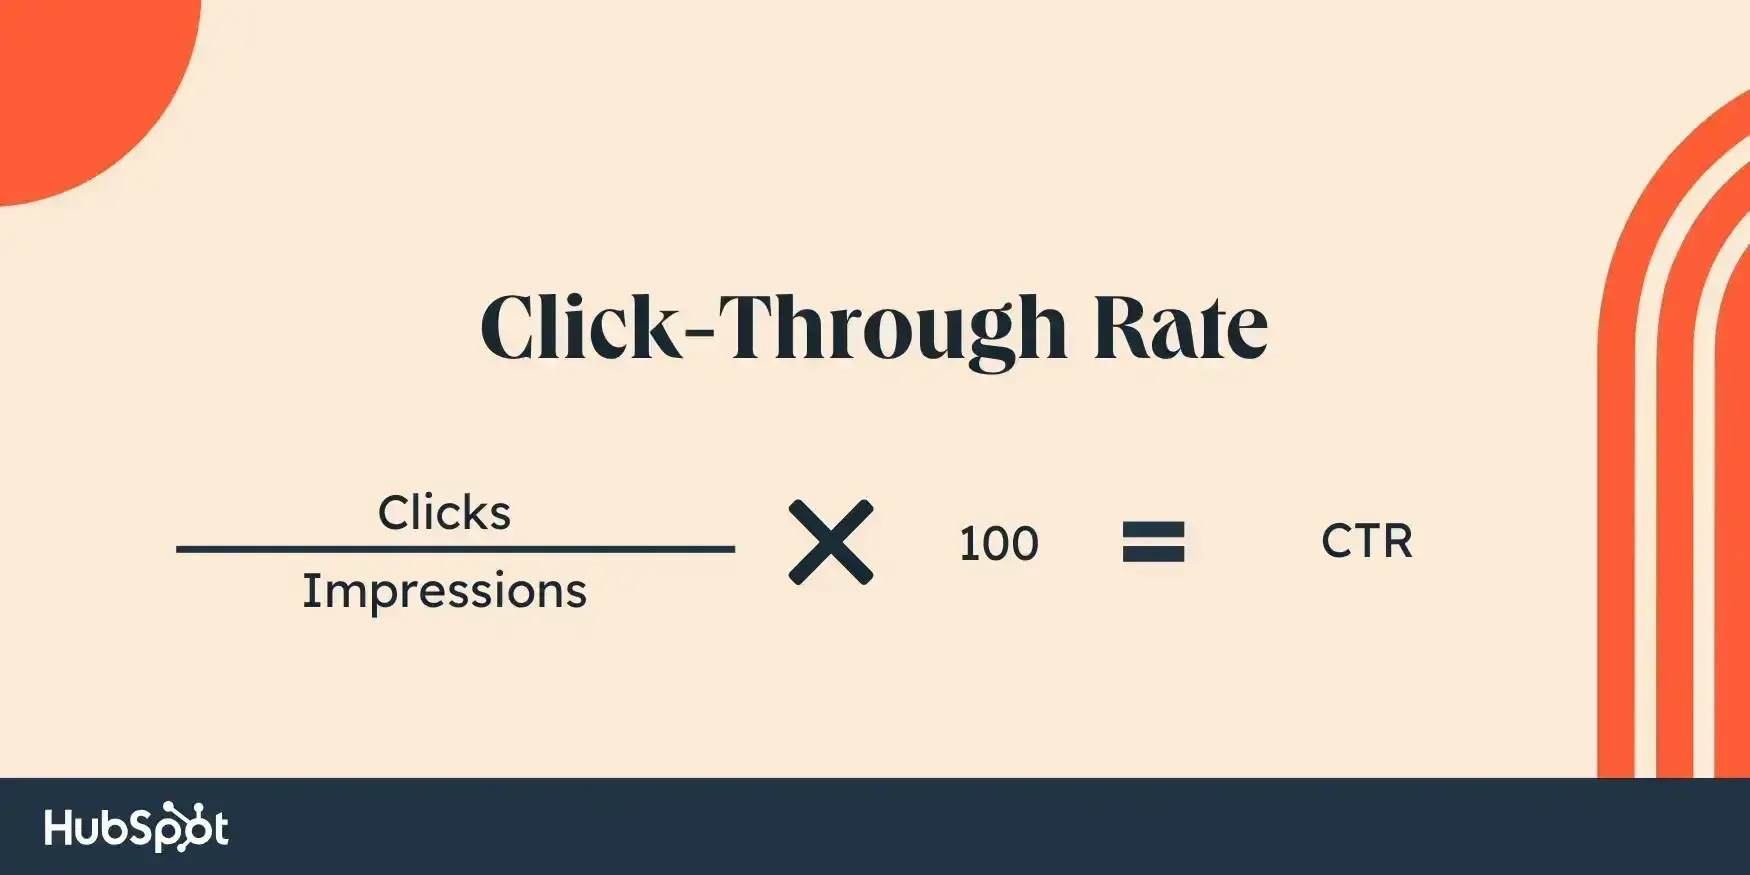
- CTR (click-through rate). This is the percentage of people who clicked on your site after seeing it in the search results. In mathematical terms, it’s clicks / impressions * 100.
You can view these metrics by going to Performance → Search results in Google Search Console:
In my experience, having all of this data can be really helpful for assessing search performance, especially in an age where Google is often changing the design of its search engine results pages (SERPs).
For example, consider a situation where your page’s average position has stayed the same, but the impressions have dropped. This could indicate that people are losing interest in that topic, either because of normal seasonality or just because the topic is no longer as relevant to the world.
HubSpot's Free Website Builder
Create and customize your own business website with an easy drag-and-drop website builder.
- Build a website without any coding skills.
- Pre-built themes and templates.
- Built-in marketing tools and features.
- And more!
In the latter situation, it could be a sign that you need to focus on different types of content to match search trends.
Or, consider a situation where a page’s average position and impressions have stayed the same, but its clicks and CTR have dropped. This could be a sign that your page’s SEO is still performing well, but Google might have changed the layout of its SERP in a way that negatively affects your page.
Unfortunately, this is something you might not be able to control, so it might be a sign that you need to target different keywords that aren’t affected by the layout change.
Brand Mentions
In answer engine optimization (AEO), brand mentions refer to the frequency with which AI answers include your brand. For example, if you’re a marketer at Hoka, you probably care a lot about whether your brand was mentioned when a user prompted ChatGPT with something like, “Tell me the best shoes for trail running.”
Tracking brand mentions helps you know if your AEO strategy is working, and whether your brand is getting associated with key terms you want to show up for in AI search (e.g., “Hoka” with “trail running shoes”).
AI Citations
Different from brand mentions, AI citations refer to how often AI answers cite your company’s website as a source. Using the same brand example as above, if you’re on the marketing team at Hoka, you care about whether your blog posts on trail running tips are getting cited in AI search.
Tracking AI citations helps you understand if your brand is seen by AI search engines and LLMs as an authority on specific topics (e.g., “Hoka” with “trail running”). And unlike brand mentions, citations can actually drive referral traffic if the AI platform includes clickable links.
Share of Voice
Share of voice (SOV) measures how your AI visibility stacks up against competitors for defined prompts. Think of a big pie consisting of you and your competitors: Share of voice answers, “How big a slice of pie is my brand in AI search?”
In a zero-click landscape, SOV is particularly important because even if a user never clicks through to your site, you’ve still won “mindshare” if they go and buy your product because they found out about it in AI search.
Conversion and Revenue Metrics
Leads, Subscribers, and/or Sales (“Conversions”)
If you’re like most publishers, you’re creating content with a specific goal in mind (though you also might be interested in general brand awareness). That goal could be generating leads for your business, getting people to subscribe to your newsletter, selling them one of your own products, or selling them a third-party product to earn an affiliate commission.
To make it simple, I’m going to group all of these different actions together and call them “conversions.” A “conversion” is when a visitor performs the action that you want them to perform.
If you want to judge whether your content is achieving its business goals, you need to track these actions.
In my experience, accurately tracking these types of conversions is one of the hardest things about tracking the performance of your content.
One major difficulty is that attributing a conversion to a specific piece of content can be difficult. For example, a reader might find your site via one piece of content but not convert until later on.
Another difficulty is that most web analytics tools won’t track conversions out of the box. Unless you’re using HubSpot Content Hub, which has built-in tools to track form submissions and lead generation, you might need to set up additional tracking to accurately attribute conversions to individual pieces of content on your site, such as setting up events or defining goals in Google Analytics.
If you’re using Google Analytics, I recommend reading these help articles and blog posts to learn more about setting up conversion tracking for your content:
- Google Analytics events (GA4)
- Key events in GA4
- A great third-party guide to GA4 conversions from Analytics Mania
Pro tip: While I have seen some sites also add UTM parameters to internal links to track conversion attribution, I don’t think this is a good idea because it also causes its own problems, even in GA4 (using UTM parameters to track attribution for external sources is totally fine, though). Instead, I recommend using event tracking as I linked above. Or, you can even set up a custom query string parameter to use if needed.
Double pro tip: If you’re performing a content analysis for a site that you monetize primarily with display ads, you can use each page’s ad RPM as a substitute for conversions.
Conversion Rate
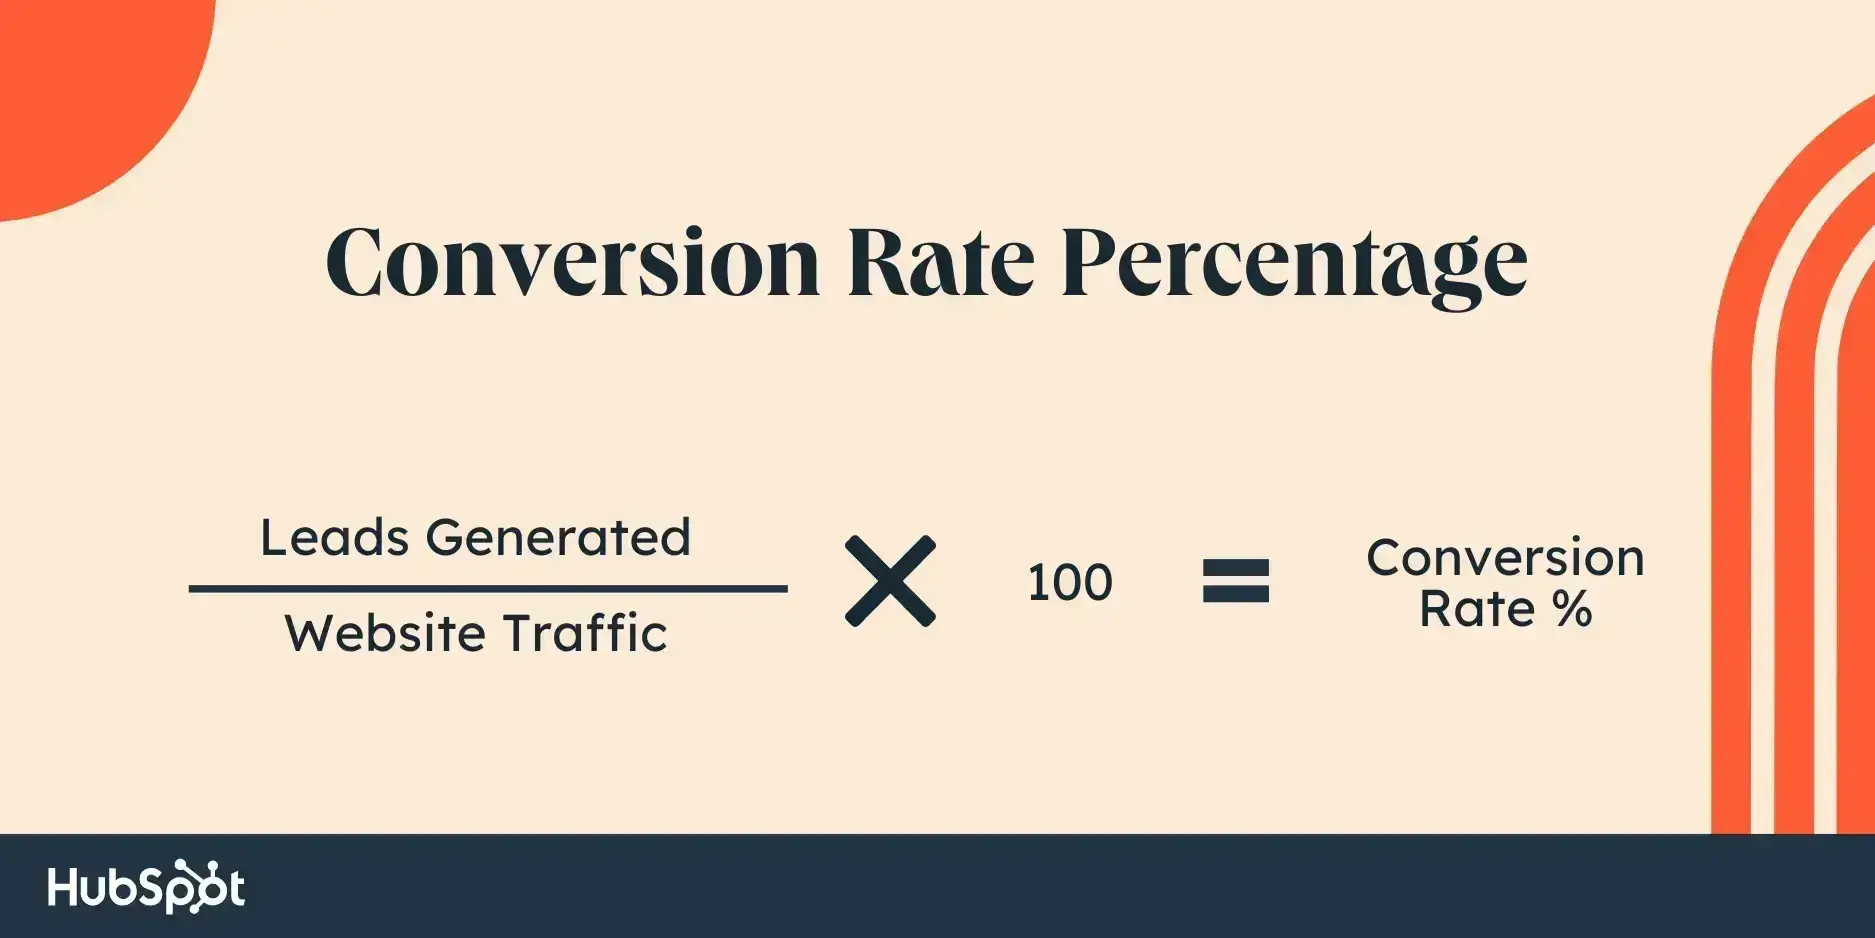
A page’s conversion rate is the percentage of visitors who perform whatever action it is you want them to, whether that’s converting to a lead, making a purchase, clicking an affiliate link, etc.
For example, if the goal of your page is to get people to subscribe to your email list, the mathematical representation of the page’s conversion rate would be subscribers / views * 100.
If you’ve set up goal/event tracking per the previous step, you should be able to view key events in Google Analytics by looking at the various engagement reports and the Key events column. Or, you can create your own custom engagement report.
Alternatively, an even simpler option is to use HubSpot Content Hub, which comes with built-in tools to track in-content conversion rates.
Return on Investment (ROI)
Content ROI refers to the revenue that you’ve gained from your content marketing efforts versus the amount you’ve spent.
In my experience, calculating an exact ROI can be difficult because of the nature of content marketing.
HubSpot's Free Website Builder
Create and customize your own business website with an easy drag-and-drop website builder.
- Build a website without any coding skills.
- Pre-built themes and templates.
- Built-in marketing tools and features.
- And more!
First off, it can just generally be difficult to set up conversion attribution for content marketing, as I discussed in the previous sections.
Additionally, if you’re publishing content that targets users earlier in the awareness funnel, there might be a long lag time between a user first engaging with your content and that person becoming a paying customer.
It’s also hard to put a specific dollar amount on “brand awareness,” which can be another big benefit of a strong content marketing strategy.
On the other hand, some types of content make it much easier to calculate the ROI. For example, if you’re publishing a review of a product for affiliate marketing, my experience has shown me that it’s pretty easy to track an exact affiliate marketing ROI:
- Use targeted tracking links to see the exact amount of affiliate revenue generated by the post.
- Compare that affiliate revenue to whatever it cost you to produce the review.
As much as possible, you should try to set up your tracking in such a way that you can accurately attribute value to your content marketing.
Pro tip: HubSpot’s Marketing Hub Enterprise plan provides you with revenue attribution — meaning you’ll be able to connect specific content pieces to the revenue they drove.
How to Level Up Your Content Performance
Tracking metrics is only half the equation. The real payoff comes from turning that data into a repeatable system for improvement. Below, I'll walk you through how to build a content performance practice that actually drives results — from choosing the right framework to creating feedback loops that compound over time.
1. Implement a measurement framework.
Before you open a single dashboard, you need a framework that connects your content goals to the metrics that prove whether you're hitting them. Without this, you’ll end up drowning in data without knowing what any of it means for the business.
Here's the process you can use:
Step 1: Define your content goals. Start by identifying the two or three business outcomes your content needs to support. These might include generating leads, driving product signups, building brand awareness, or increasing customer retention.
Step 2: Map metrics to each goal. For every goal, choose a primary metric (the one you'd report to leadership) and two or three supporting metrics that help explain the “why” behind that number. For example:
- Goal: Lead generation. Primary metric: form submissions. Supporting metrics: conversion rate, traffic source breakdown, landing page bounce rate.
- Goal: Brand awareness. Primary metric: brand mentions. Supporting metrics: new users, keyword rankings, share of voice.
- Goal: Customer education. Primary metric: average engagement time. Supporting metrics: scroll depth, video completion rate, return visitor rate.
Step 3: Document your framework. Write it down — even if it's just a simple table in a shared doc. Having a documented framework makes it dramatically easier to stay focused during analysis and get alignment from stakeholders on what “good” looks like.
Pro tip: If your team uses HubSpot Marketing Hub on the Professional or Enterprise plan, you can use its campaigns tool to group related content assets together and track performance against shared goals, which makes framework implementation much more practical at scale.
2. Build performance dashboards.
One of the biggest friction points in content performance tracking is that the data lives in too many places. Your organic traffic is in Google Analytics, your keyword rankings are in Search Console, your AI visibility data is in a third-party tool, and your conversion data might be somewhere else entirely.
The fix is consolidating your most important metrics into a single dashboard (or as few dashboards as possible). Here are the tools I recommend:
- Google Analytics 4 custom reports. GA4 lets you customize detail reports or build new ones. For example, you could add a bounce rate column to the Pages and screens report.
- Looker Studio. If you want to pull data from multiple sources into one view — say, GA4 traffic data alongside Google Search Console keyword data — Looker Studio is free and connects to both natively. This is a great tool for building a consolidated content performance dashboard.
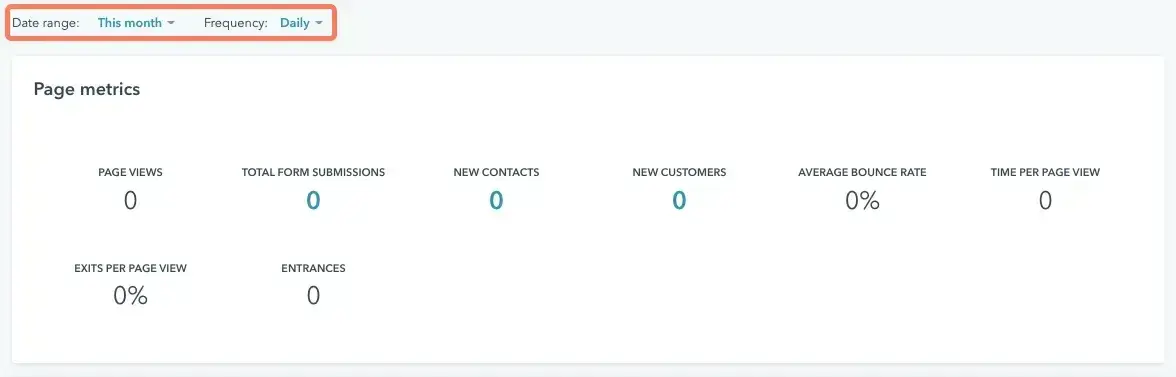
- HubSpot Content Hub. If your content lives in HubSpot Content Hub, you already have built-in analytics that track page views, total form submissions, new customers, and bounce rate per page. The site speed dashboard also monitors Core Web Vitals, so you can catch performance issues before they affect rankings.
The goal isn't to track every metric in one place. It's to get your primary and supporting metrics (from your framework above) into a view you can check in five minutes instead of thirty.
3. Set up tracking from day one.
As someone who's had to retrofit content performance tracking onto an existing website, I can tell you with certainty: It’s not fun. You end up manually configuring event tracking across hundreds of pages and wishing you had months of historical data that simply doesn't exist.
If you're launching a new site or starting a new content program, invest the time upfront to:
- Install your analytics tools (at minimum, Google Analytics and Google Search Console) before you publish your first piece of content.
- Define your key events. Decide what actions count as conversions — form submissions, email signups, product clicks, etc. — and set up event tracking for them from the start.
- Establish a tagging convention. Use consistent UTM parameters for external promotion and consistent naming conventions for content categories, authors, and campaign tags. This makes filtering and comparing performance far easier later.
- Document everything. Keep a simple changelog of what you published, when, and any notable changes (new CTAs, updated content, design changes). You'll thank yourself when you’re trying to explain a traffic spike or drop six months from now.
If you're already working with an existing site and missed this window, it’s still worth setting things up now. The sooner you start collecting clean data, the sooner you'll have meaningful trends to act on.
4. Analyze with context.
As I've tried to highlight throughout the metrics sections above, there’s no universal benchmark that applies to every piece of content. A “good” bounce rate for one page might be a red flag for another. A low average engagement time on a quick-reference page might be perfectly fine, while the same number on a long-form guide would signal a problem.
When you sit down to analyze performance, always ask these questions:
- What was this content's goal? A blog post designed for top-of-funnel awareness should be evaluated differently from a product comparison page designed to convert.
- What audience was this content targeting? New visitors from organic search behave differently than returning subscribers from an email campaign. Segment your data by traffic source before drawing conclusions.
- What's the content’s lifecycle stage? A post published last week shouldn't be compared to one that’s had 12 months to accumulate backlinks and ranking authority. Give content time to mature before making judgments.
- What external factors might be at play? Seasonality, algorithm updates, competitor activity, and even news cycles can all influence performance. Check whether a dip is content-specific or site-wide before making changes.
Teams can waste significant effort “fixing” content that was actually performing exactly as it should for its purpose. Context prevents that.
5. Create continuous improvement loops.
Content performance analysis isn't a one-and-done exercise. The real value comes from building a regular review cadence that turns insights into action.
Here's a monthly review process that you can implement to keep improving:
- Pull and review data. Check your dashboards for the previous month's performance. Look for pages with significant changes (positive or negative) in traffic, engagement, or conversions.
- Identify patterns and priorities. Group your findings into themes. Are certain content formats consistently outperforming others? Are specific topics losing traction? Are there pages with high traffic but low conversions that need CTA optimization?
- Take action. Based on your priorities, make targeted updates. This might mean refreshing outdated content, improving CTAs on high-traffic pages, creating new content around topics that are gaining momentum, or deprioritizing formats that aren't delivering.
- Document and share. Record what you changed, why, and what you expect to happen. Share a brief summary with stakeholders — this builds credibility for your content program and makes it easier to secure resources.
Over time, this loop creates a compounding effect: Each cycle of measurement, analysis, and optimization makes your content strategy sharper and more aligned with what your audience actually responds to.
Start measuring content performance today.
If you're feeling overwhelmed by everything above, here’s a quick-start checklist to get moving on your content performance right now:
- Set up Google Analytics and Google Search Console if you haven't already — both are free.
- Pick one content goal (e.g., lead generation) and identify its primary metric (e.g., form submissions).
- Set up one key event in Google Analytics to track that metric.
- Create a simple dashboard — even a Google Analytics custom report or a spreadsheet — that tracks your primary metric alongside traffic and engagement for your top 10 pages.
- Schedule a 30-minute monthly review to check progress and identify one action item.
You don't need a perfect system to start getting value from content performance tracking. You just need to start, then refine as you go.
Editor's note: This post was originally published in May 2025 and has been updated for comprehensiveness.
HubSpot's Free Website Builder
Create and customize your own business website with an easy drag-and-drop website builder.
- Build a website without any coding skills.
- Pre-built themes and templates.
- Built-in marketing tools and features.
- And more!


.webp)