.png?width=112&height=112&name=timeline%20(1).png)
When I carried a quota at IBM, I learned there's a difference between “lots of opportunities” and a pipeline you can trust. One month, I had my forecast packed with commits; by the end of the month, I was explaining two slips, a legal stall, and a deal with no exec sponsor.

The problem wasn't a lack of effort — it was a lack of structure. Everything changed when I started treating the sales pipeline like a system: using buyer-aligned stages, maintaining clean data in the CRM, and establishing a weekly rhythm that forces real next steps onto the calendar.
In this guide, I‘ll share my approach to sales pipeline management today — what it is, why it matters, and the practical steps I take to build, review, and refine it so that the forecast aligns with reality — and I’ll use examples from deals I've actually worked on.
Table of Contents- What is a sales pipeline?
- How to Run a Sales Pipeline Review
- How to Build a Sales Pipeline
- How to Clean Up Your Sales Pipeline
- Sales Pipeline Analysis: Key Sales Pipeline Metrics to Track
- An Easy Sales Pipeline Template
.png)
Free Sales Metrics Calculator
A free, interactive template to calculate your sales KPIs.
- Average Deal Size
- Customer Acquisition Cost (CAC)
- Customer Lifetime Value (CLV)
- And more!
Download Free
All fields are required.
Form not available
What is a sales pipeline?
A sales pipeline is a visual snapshot of where your deals are in the sales process. It shows the key stages a potential customer moves through — from the first “Hey, I'm interested” to the final “Let's do this” handshake. Think of it as a map that helps you (and your team) track, organize, and move deals forward with purpose.
Every company has its own sales process. Even within the same company, pipelines can look different depending on the product or service you‘re selling. Some prospects show up ready to buy, already sold on your product after doing their homework, while others stall. That’s why there's no one-size-fits-all setup.
And that‘s also the beauty of a sales pipeline: it allows you to adjust your sales approach based on where someone is and how fast they’re moving.
I once committed a deal early in the year to close by the end of the second quarter, which lined up with the client‘s fiscal year-end. As it turned out, the prospect’s priorities shifted, and they lost project funding for my deal. Fortunately, I had maintained healthy 3X pipeline coverage, and I was able to close another deal before the quarter ended. A sales coach once told me always to have smaller deals ready to close in case a big one falters — that advice has saved me more than once.
A well-built sales pipeline also gives you visibility into your revenue. Sales managers can forecast more accurately by looking at where each deal sits in the pipeline, how long it‘s been there, and how likely it is to close. It’s a simple tool, but when used right, it becomes a powerful engine for growth.
Typical Sales Pipeline Stages
While the specific stages can vary depending on your industry and sales process, a typical sales pipeline includes the following stages.
Prospecting
This is the first step, where you actively search for potential customers who might benefit from your product or service. If you're selling software, that might mean identifying companies in a certain industry or size range that struggle with the problem your solution solves.
Lead Qualification
Once you‘ve identified some leads, the next step is figuring out if they’re a good fit. You assess things like their needs, budget, buying timeline, and whether you're speaking to someone with decision-making power.
Pro tip: I like to use a “reverse qualification” approach, where you actively look for reasons to disqualify leads. This saves time and helps your team focus on prospects who are actually worth pursuing.
Initial Contact
Here, you reach out to qualified leads via email, phone, or social channels. The goal is to start a conversation, learn more about their pain points, and provide enough value upfront to keep the door open for deeper engagement. This stage is about listening, not pitching.
Proposal
If the lead is engaged and there‘s clear interest, you move to presenting a formal proposal. This should be tailored to their specific needs and include pricing, features, and key benefits. The proposal isn’t just a document — it's your chance to make a strong case for why your solution is the right one.
Negotiation/Commitment
At this stage, both sides work through the final terms, such as pricing, contract details, implementation timelines, and any lingering concerns. Strong negotiation skills help remove roadblocks and move the deal toward a close without stalling momentum.
Closing (or Lost)
This is where the deal is either won or lost. If you close successfully, you move forward with onboarding or implementation. If not, you need to log why the deal didn't go through. Those insights can help refine your messaging, improve your sales process, and increase your win rate over time.
Pro tip: I like to use this sales conversion and close rate calculator!
Sales Pipeline vs. Sales Forecast vs. Sales Funnel
Sales Pipeline vs. Sales Forecast
People often confuse “sales pipelines” with “sales forecasts,” but they are completely different.
A sales pipeline is a visual representation of where prospects are in the sales process. It tracks potential customers from initial contact through various stages until the deal is closed or lost.
On the other hand, a sales forecast estimates the future sales revenue for a specific time period, usually based on historical data, market trends, and current pipeline information.
For example, if a sales forecast anticipates missing your quota, you should double down on selling activities. But if it estimates a 150% growth compared to the last month, you'd want to scale back your efforts and start laying the groundwork for an equally successful next month.
While sales pipelines and forecasts are distinct, they are closely related. An accurate and well-managed pipeline is crucial for creating reliable sales forecasts. Once you've started tracking your sales pipeline, that data can allow you to create a forecast using sales forecasting software like Sales Hub.
Sales Pipeline vs. Sales Funnel
People also often use “sales pipeline” and “sales funnel” interchangeably.
However, a sales funnel suggests that the number of prospects you're working with will drop consistently as the sales process continues.
This leads to a false belief that you need three times as many prospects at the top of your funnel as at the bottom. For instance, a sales manager following this philosophy would ask his rep to connect with 300 buyers to close 100 deals.
Sales educator and expert Jeff Hoffman clears this misconception by calling a sales pipeline a wide-mouthed cocktail glass instead of an evenly shaped funnel.

You may have a ton of prospects entering your pipeline, but the vast majority drop off after the qualification stage. After prospects have passed the critical point, most should become customers.
How to Build a Sales Pipeline
Building a pipeline isn‘t about copying someone else’s playbook. It's about designing a system that reflects your buyer's journey and provides a clear, actionable view of how deals progress.
Here's how I approach it.
1. Define the stages of your sales pipeline.
A pipeline only works if its stages mirror how your buyers actually make decisions. Too many teams build around the seller's internal checklist (demo sent, proposal out) instead of the buyer's journey. When that happens, your data drifts from reality, and your forecast loses credibility.
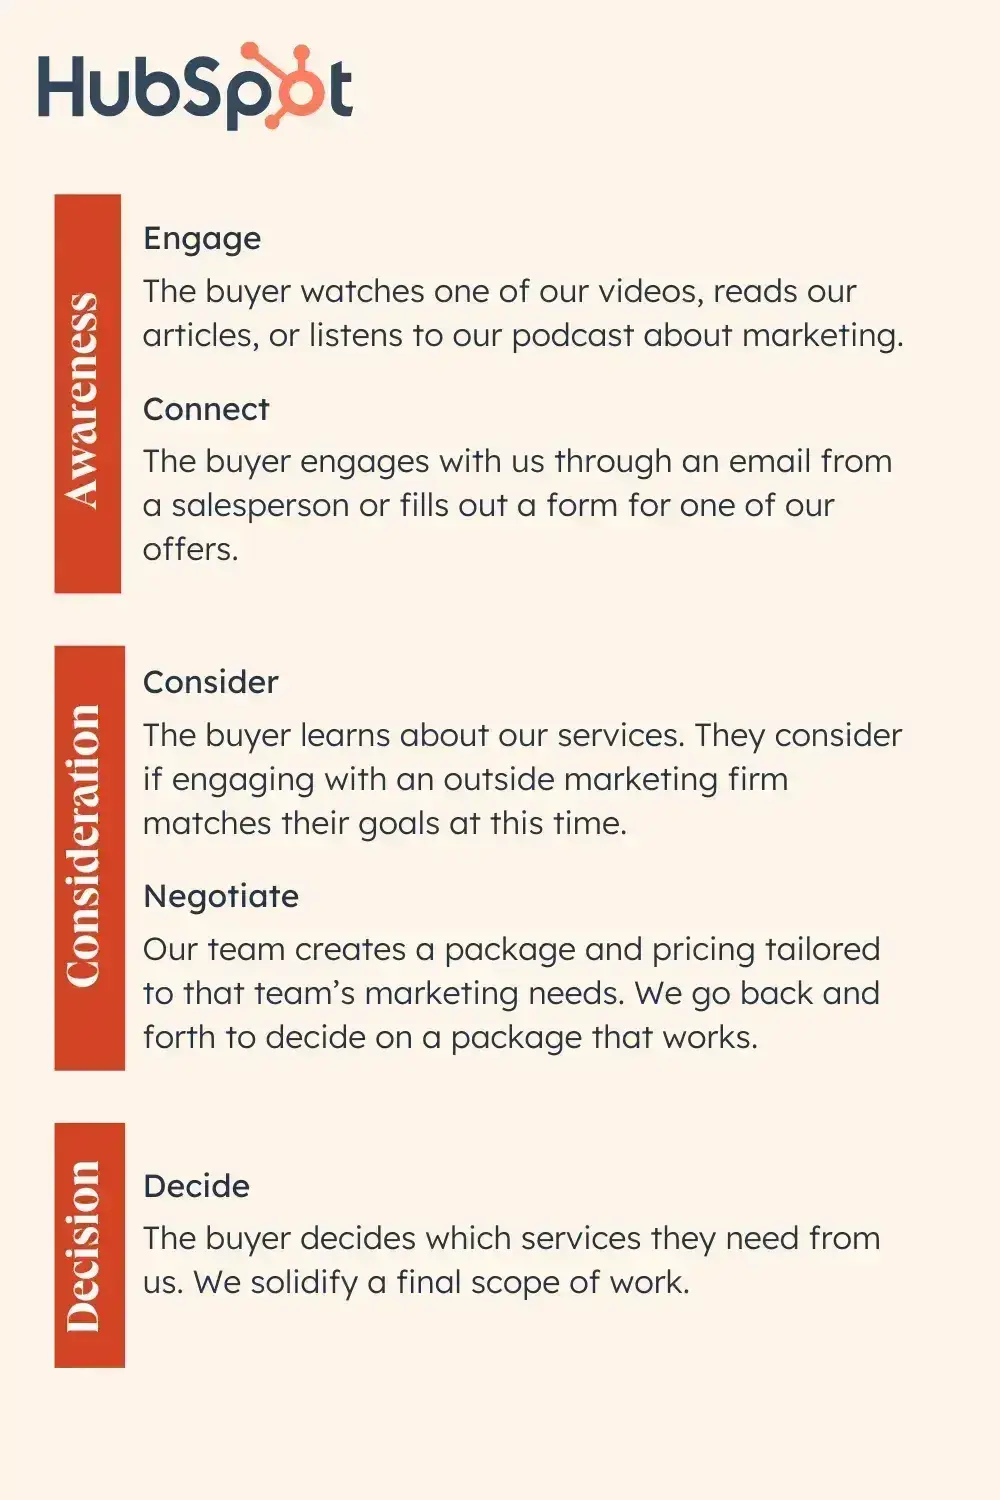
Start with the buyer journey (Awareness → Consideration → Decision).I start by watching what buyers actually do. In the Consideration phase, the real signals are concrete: they put time on the calendar, pull a technical stakeholder into the thread, or request a short proof of concept. In the Decision phase, you‘ll see legal/security kick off and an exec sponsor weigh in. If I can’t point to a buyer action, it's not a stage.
Map buyer actions to pipeline stages. Once I‘m clear on the buyer’s path, I convert it into the handful of stages we actually update in CRM. I keep it simple and name only the moments that reflect a real buyer milestone. Each stage needs an objective exit criterion — such as “discovery completed with decision maker,” not “feels warm.”
Build your pipeline around the customer journey, not your internal steps. If a stage doesn't reflect a real buyer milestone, remove it.
Free Sales Metrics Calculator
A free, interactive template to calculate your sales KPIs.
- Average Deal Size
- Customer Acquisition Cost (CAC)
- Customer Lifetime Value (CLV)
- And more!
Download Free
All fields are required.
Form not available
My Sales Pipeline Framework
In the companies where I worked, we typically had six to eight sales stages that resembled the framework below. Your deal stage names and numbering may vary, which makes CRM and sales automation platform adoption easier. Just as in the real world, deals should have the mobility to move up and down the pipeline until they are signed, sealed, and delivered.
|
Stage |
Close Probability |
Description |
|
Lead Generation |
10% close probability |
In this scenario, we upload leads from event attendee lists, trial requests, gated content forms, webinar audience members, or other early-stage prospects. They didn't specifically ask for a call, but are deemed outreach-worthy. |
|
Lead Nurturing |
20% close probability |
Once I make first contact with a prospect via email, phone, or at an event, I “park” a lead in this stage. Hopefully, there‘s commitment to a meeting or conversation, but I’m not ready to attract forecast-related attention yet. |
|
Marketing Qualified |
30% close probability |
During this stage, I discuss the prospect‘s business needs, inquire about what sparked their interest in my business, and determine if they’re also in contact with other suppliers or service providers. I start scoring the lead with BANT criteria (budget, authority, need, timeline) and conditions of satisfaction. This stage or the next may be the ideal time for a discovery call, depending on the complexity of the sales process or the prospect's needs. |
|
Sales Accepted |
40% close probability |
I shift a lead to this stage once I‘ve determined that a prospect meets the criteria for an ideal customer profile, and they’re giving signals of real engagement. They're interested in a presentation, success stories, or use cases. They may ask for pricing, contract options such as tiered subscription plans, or assistance with building a business case for their team. If I don't feel enthusiasm or a willingness to move forward, I ask about their concerns or objections. Unstated objections are often the hardest to overcome, so I prefer to address them openly. |
|
Sales Qualified |
50-75% close probability |
When a customer shows signs of being committed to the path of doing business with me — such as requesting a formal proposal or contract terms like a Master Services Agreement or SaaS licensing agreement—I'm typically willing to commit to a deal for the fiscal quarter, or at least for the fiscal year. For many organizations, as I‘ve learned lately as a proposal developer, a Request for Proposal isn’t the end of the purchase negotiation process; it's only shifting into a higher gear. |
|
Closed |
100% close probability |
When you receive a purchase order, corporate credit card, or a signed contract, the evolution of a prospect into a customer is often an exciting milestone. Scheduling kickoff meetings, reminiscing about pre-sale negotiations, and receiving payment bring the kind of satisfaction that is only outdone by seeing the commission payment numbers in your bank account. You‘re no longer making promises of value, committing to delivering high-quality products and services, and addressing your customers’ business needs. It‘s time to live up to those promises and ensure that the contracting process meets the client’s expectations — and those of your finance and legal teams to close the business transaction without any audit exposures. |
|
Post-sales |
Depending on the nature of your sales team's role, your post-sale role may be to:
|
How I use this framework: I keep the buyer-journey lens as my north star, then map these seven stages to specific exit criteria (e.g., “Economic buyer confirmed,” “Security review submitted,” “Mutual action plan agreed”). That gives me cleaner data, more precise coaching, and a forecast I can actually trust.
Pro tip: I routinely audit stage definitions with my team. If two reps can‘t agree on what it takes to move a deal from ’Appointment Completed ‘to ’Solution Proposed, ‘the definition isn’t clear enough. We tighten the exit criteria, adjust the CRM picklists, and (if needed) collapse redundant stages.
2. Identify how many opportunities continue through each stage.
A healthy pipeline tells you more than just how many deals are in play — it tells you where they actually move forward. Review your historical conversion rates to determine the percentage of opportunities that advance from one stage to the next.
I pay close attention to the early handoffs. If only 20% of leads move from Lead Nurturing to Marketing Qualified, that‘s a bottleneck in qualification or engagement. In those cases, I review rep outreach, lead quality, messaging, and timing to pinpoint what’s blocking momentum.
I also assign yield probabilities by stage (e.g., Lead Gen: 10%, Nurturing: 20%, MQL: 30%, Sales Accepted: 40%, Sales Qualified: 50-75%, Closed: 100%) based on our data. The goal at this step is visibility into movement and quality, not forecasting — the math comes next.
3. Calculate the opportunities you need to hit your goals.
Once I've set yield probabilities by stage, I size the funnel from the top down using the same two-step flow as the original.
Step 1 — Revenue → DealsDeals needed = Target revenue ÷ Average deal sizeExample: $200,000 target ÷ $5,000 ADS = 40 deals needed this quarter.
Step 2 — Deals → Required coverage per stageRequired opportunities at Stage S = Deals needed ÷ Stage-S yieldExample: If your Negotiation (or Sales Qualified equivalent) yield = 90%, then 40 ÷ 0.90 ≈ 45 opportunities must reach that stage.
Repeat this process for each stage, using its corresponding historical yield (e.g., Lead Gen: 10%, Nurturing: 20%, MQL: 30%, Sales Accepted: 40%, Sales Qualified: 50–75%, Closed: 100% in my model). This provides you with the total milestone counts by stage.
Divide by rep and timebox it.Convert those milestone counts into weekly opportunity adds and meetings booked per representative, so activity ladders directly align with coverage and coverage ladders with the goal.
Compact formula (from revenue straight to coverage at a stage): Required opportunities at Stage S = Target revenue ÷ (Average deal size × Stage-S yield)
I revisit yields monthly. If the Sales Qualified close rate improves (say 60% → 65%), required coverage falls; if it softens, coverage rises. Adjusting these targets keeps the pipeline balanced and the forecast real.
Here's an example from Bob Marsh, CEO of LevelEleven, currently Chief Client Officer at OnTrac AI. Assume you need 2,000 deals per year to hit your target bookings.
- 2,000 deals/year = 167 deals per month
- 8,000 proposals/year = 667 proposals per month
- 32,000 meetings/year = 640 meetings per week
- 64,000 calls/year = 256 calls per day
If you have a 100-person team, that translates to:
- 167 deals per month/100 reps = 2 deals per month
- 667 proposals per month/100 reps = 7 proposals per month
- 640 meetings per week/100 reps = 7 meetings per week
- 256 conversations per day/100 reps = 3 calls per day
Salespeople can use these benchmarks to measure their progress against the targets.
These are illustrative. Every team‘s stage yields differ. If one rep struggles to prospect but has a standout demo-to-close rate, they’ll need fewer initial meetings than peers to hit quota. Calibrate your ratios to your historical stage yields (Step 2) so that activity targets align with how your pipeline actually converts.
4. Understand the commonalities between opportunities that convert.
I don't stop at what closed; I analyze who and why it closed so I can focus the pipeline on look-alike deals.
What I examine (fast, repeatable lenses):
- Segment & use case. Industry, company size, problem pattern.
- People. Champion's title/influence and whether an economic buyer shows up early.
- Trigger events. New leadership, budget cycles, compliance deadlines, consolidations.
- Engagement trail. Content/pages viewed, events attended, trials started before the demo.
- Deal shape. Discounting, redlines/security review, and any steps that consistently slow (or accelerate) velocity.
- Path to value. Proof points that appear in wins (ROI one-pagers, a specific case study, a trial checklist).
How I run the analysis (without changing the process yet):
- Pull last quarter's Closed-Won plus late-stage opportunities.
- Tag each with the lenses above (quick fields or spreadsheet columns).
- Sort by win rate, cycle time, and ASP to spot the strongest patterns.
- Write down the top 3–5 signals that show up in faster/higher-value wins (e.g., exec sponsor present by second meeting, trial started within 7 days of discovery, security review kicked off in parallel).
What I do with the findings (at this step):
- Update my ICP notes and targeting focus so sourcing tilts toward the segments/roles that convert.
- Capture the signals list and the common friction points so I'm clear on what “good” looks like and what typically stalls momentum.
This step is about pattern recognition, not process changes. I'm isolating the signals that separate high-fit deals from noise.
5. Create or adapt your sales process around this data.
Once you've identified the key actions and behaviors that drive successful conversions, shape your sales process around these insights. If you don‘t have a defined sales process yet, this is the perfect opportunity to create one; if you do, it’s time to update it based on the data.
Once the patterns are clear, I codify them so they're part of how I sell:
- Stage exit criteria. If fast wins include an economic buyer early, I add “economic buyer confirmed” before advancing. If trials correlate with higher win rates, I need a simple checklist for trial success.
- Timed touchpoints & proof. If a 48-hour follow-up lifts conversion, I make it standard. If a specific case study or ROI one-pager shows up in wins, I specify when to send it (e.g., post-discovery recap).
- CRM reflection (lightweight). I keep stages simple and add one or two required fields/checkboxes tied to exit criteria (e.g., exec sponsor yes/no). No bureaucracy — just enough structure to keep data honest.
This keeps the pipeline clean and the playbook actionable, without turning stages into a maze.
6. Continuously add leads to your pipeline.
Dry pipelines occur when end-of-month closings crowd out prospecting. And prospecting is hard — 71% of sales professionals say it‘s their most challenging activity. That’s why I treat prospecting as non-negotiable so that the next month doesn‘t suffer for this month’s finish.
Here's what I do:
- Block it. I reserve a short daily window for new outreach and don't let closing work interfere with it.
- Make it measurable. I set a simple weekly add goal (new opportunities or qualified meetings) and track it — no guessing.
Mix your sources. Outbound to my ICP, fast follow-up on inbound, plus referrals/partners, so I'm not dependent on one channel. - Keep the bar high. Only create opportunities that meet basic ICP/qualification; everything else goes to nurture.
- Keep momentum. Every touch ends with a time-bound action; I recycle stalled leads into a nurture cadence instead of leaving them in a stage.
Staying consistent here prevents the 3–6 month lag that quietly kills quarters. Lead generation and prospecting tools can also help by aggregating potential leads and tracking their status. That way, you always know how many leads you‘ve got and what stage they’re in.
Free Sales Metrics Calculator
A free, interactive template to calculate your sales KPIs.
- Average Deal Size
- Customer Acquisition Cost (CAC)
- Customer Lifetime Value (CLV)
- And more!
Download Free
All fields are required.
Form not available
7. Maintain the health of your pipeline.
A healthy pipeline isn‘t the largest one — it’s the truest one. If a deal can‘t meet the exit criteria for its stage or it’s sitting without a scheduled next step, I move it to nurture or close it out. I also watch time-in-stage — once an opportunity blows past a reasonable window with no movement, it's a downgrade, not a “maybe.”
Clean data matters, too. Only 35% of sales pros say they completely trust their data, which is a big reason forecasts wobble. I keep a few required fields tied to exit criteria (e.g., economic buyer confirmed, success metrics captured) so the pipeline reflects what's actually happening — not just how we feel about the deal.
To keep follow-up consistent, I give the team a simple, explicit system:
- Every inbound lead is contacted within six hours or less.
- Every lead receives 10–12 touches over one month.
- Every lead gets a mix of email, phone, and social touches.
- Every touch adds something new (resource, case study, quick video, trial tip, or a tighter next step).
Again, if a lead doesn't engage after the full cadence, I recycle it to nurture.
How I structure my week for pipeline health:
Over the years, I‘ve learned that maintaining a healthy pipeline comes down to protecting time for the right activities. Here’s what works for me:
- Block time by activity type. I designate one day each week to follow up on deals with the highest propensity to close. I book another day on my calendar for pipeline-building outreach. The other days are for meetings, demos, admin work, and internal sessions.
- Tackle the hard stuff first. Procrastination kills momentum. I “eat the frog first” by tackling the most difficult (but unavoidable) tasks early in the day — cold calling or delivering tough news to a customer. The rest of the day feels easy in comparison.
- Control what you can control. Sales coach Dave Tear put it best: focus on the activities in your job that you can control, and don‘t beat yourself up about the results as much. Meet your outreach, follow-up, and pipeline requirements. Follow your company’s sales methodology and do your best to close deals.
- Balance quick wins with long pursuits. I segment my pipeline into smaller, attainable wins and high-value, challenging pursuits. I call them rabbits and moose — you might call them big game and small game, or if you prefer, low-hanging fruit and tree-top bananas. (I heard that last analogy at an SAP sales kickoff event, and it stuck with me.)
The point is to divide your attention between smaller, quicker wins and slower-moving, high-value deals.
8. Clean your sales pipeline regularly.
I don‘t treat cleanup like spring cleaning — I make it part of my weekly routine. I spend a few minutes each week clearing out deals that haven’t moved, and I take a more thorough pass once a month to re-qualify maybes and update contacts who have changed jobs.
If a deal doesn‘t have a decision maker confirmed, success metrics defined, or a calendar commitment, it’s not “active” — it either goes to nurture or I close it out.
What I actually do:
- Kill or downgrade anything past its time-in-stage threshold with no activity scheduled.
- Re-check fit on the fence-sitters; keep only ICP-fit, engaged prospects in active stages.
- Update stakeholders and contact owners so we‘re not chasing people who’ve moved on.
In pipeline reviews, I use this same lens — surfacing the stalls, confirming exit criteria, and assigning owners with dates so that cleanup happens as part of the review, not as extra homework.
How to Run a Sales Pipeline Review
- Gather relevant data.
- Prepare a clear agenda and structure.
- Review key pipeline metrics.
- Analyze deal movement and stagnation.
- Update and adjust strategies.
- Create an accountability mechanism for reps and managers.
Pipeline reviews can be uncomfortable — for reps and managers. I‘ve chased my share of rainbows (swore a deal would land this quarter… then watched it slip), and I’ve seen sandbagging when someone already hit quota. That's why I set a simple ground rule up front: total transparency. Don‘t overstate, don’t understate.
If the pipeline isn‘t sitting at the 3x–5x (sometimes 10x) coverage leadership wants, say so. I’d rather work the bottlenecks than pretend they aren‘t there. Forecast accuracy builds trust up and down the ladder; nothing tanks credibility faster than rosy numbers that don’t close.
Here's how you can run an effective sales pipeline review to keep things on track.
1. Gather relevant data.
I pull just enough to tell the story, not every field in the CRM. For each active deal, I want to see the current stage, owner, last touch, the next step with a date, amount, and close date. Then I skim what actually changed since the previous review — what moved forward, what went quiet, what got pushed.
Numbers alone won't explain a stuck deal, so I also ask reps for the quick context from their last touch: Who's the economic buyer? Any objections? Is legal or security in motion? If I can‘t tell — in sixty seconds — why a deal is stuck and what would move it, I don’t have the correct data.
That's it. Lean, honest, and usable. Everything we look at should help us make one of three calls: advance it, adjust the plan, or remove it from the forecast.
2. Prepare a clear agenda and structure.
I keep pipeline reviews human and straightforward. I book 25 minutes, pull up the live pipeline, and we stick to a simple three-part agenda:
- Quick snapshot (2–3 min). What moved since last time — won, slipped, added. No speeches.
- Work the few that matter (15–18 min). We only discuss deals that can close this month or are looking stuck. For each one: what‘s blocking it (buyer, timing, legal/security), and what’s the one scheduled next step? If we can‘t name that in a minute, it doesn’t belong in the forecast.
- Read-back (2–3 min). We recap the commitments — who‘s doing what, by when. If there’s no dated next step, we downgrade it. Accuracy beats optimism.
That‘s it. Short, focused, and honest — no sandbagging, no “waiting to hear back” as a plan, and no debating deals that don’t meet the stage exit criteria.
3. Review key pipeline metrics.
Early on, I ran reviews with a dozen charts on the screen. We spent 20 minutes arguing about colors and filters, and almost no time deciding what to do. Now I keep it human: five simple checkpoints, a quick read on whether we're getting better or worse, and then back to deals.
- Qualified leads. I start here because quality at the top decides everything else. “How many new opportunities this period clearly fit our ICP?” If we opened 80 and only 30 are truly qualified, I know why the middle of the funnel feels thin.
- MQL → SQL conversion. This indicates whether the handoff is working. If marketing sent 120 MQLs and we accepted 60, that‘s 50%. If it drops, I don’t call a meeting — I fix the handoff (clear criteria, faster follow-up, better context in the notes).
- Win rate. Of the deals we actually worked, how many closed? If we pushed 40 into late-stage and won 10, we‘re at 25%. I don’t overthink it; I ask “What changed?” (Different segment? New competitor? Fewer exec sponsors?)
- Average deal size. Are we moving upmarket or discounting to win? I track whether our average deal size (ADS) is trending up or down. If the win rate looks fine but ADS keeps shrinking, we‘re probably discounting too much or chasing smaller deals. I’d rather lose bad-fit deals than train the team to win only on price.
- Sales cycle length. Faster isn't always better — but an unexplained slow turn is a warning. If our median sales cycle crept from 35 to 42 days, I look for the usual suspects: no economic buyer, legal/security started too late, or a weak mutual action plan.
If one of these looks off, we identify one next step, one owner, and one date, and then move on.
4. Analyze deal movement and stagnation.
Most stalls aren't mysteries. They usually come down to one of three things: slow or inconsistent follow-up, soft qualification, or not mapping a pitch to real pain/ROI.
And speed matters more than we like to admit. While buyers expect quick replies, the average B2B response time is over 40 hours — and more than half of companies take five or more days to respond. That's plenty of time for momentum to die.
When I see a deal sitting in Proposal or Negotiation with no movement, I double-check the basics: Did we respond promptly and maintain a steady pace? Did we confirm need, authority, and success metrics? Did we put the right proof in front of the right person (case study, ROI, trial results)?
Research shows that 80% of sales require five or more follow-up calls after the meeting, but 44% of salespeople give up after one. Consistent follow-up isn‘t optional — it’s the difference between closed and forgotten.
For example, suppose proposals sit for weeks without a reply. In that case, I tighten the follow-up window (from same day to 48 hours to weekly) and ensure every touch adds something new — a relevant case study, a concise ROI one-pager, or a clear milestone, such as “security questionnaire submitted by Friday.”
If a negotiation goes quiet, I reset with a quick mutual action plan: dates, owners, and the one step that would change the deal's posture (e.g., executive sponsor intro or legal kickoff).
5. Update and adjust strategies.
The review isn‘t complete until we make a change. I select one or two moves we’ll make before the next session, assign an owner and a date to each, and log them in the CRM while we're still on the call.
Typical changes are simple: shift time toward the segments that showed up in recent wins, tighten the MQL→SQL handoff if it has slipped, or start legal/security earlier if it continues to slow us down.
If a deal's date slipped twice, I lower the forecast class. If we want to try something new, we run a short experiment — say, adding a lightweight mutual action plan to every proposal — and check the impact next time.
6. Create an accountability mechanism for reps and managers.
If it isn‘t written down with an owner and a date, it didn’t happen. I keep this simple and visible. For every decision we make during the review, I log a single action on the deal in the CRM, assign a single owner (not a committee), and include a date — usually with a task or calendar invite — so it appears in our workflow.
I also ask for receipts. Every action needs something tangible that we can point to, such as a calendar event, an email thread, a mutual action plan link, or a kicked-off security questionnaire. Between reviews, I do a quick five-minute skim of what‘s due. If an action slips twice, we either downgrade the deal or reset the plan; I don’t let rolling dates hide a stuck opportunity.
At the following review, we begin with a quick read-back: last week‘s actions, completed or not. No speeches — just close the loop and move on to unblocking what’s next.
Sales Pipeline Reviews vs. Sales Forecast Reviews
I treat these as different conversations.
- A pipeline review is about momentum and quality — why deals are (or aren‘t) moving and what we’ll do next.
- A forecast review is about numbers and confidence — what we expect to book during this period and how certain we are.
In a pipeline review, I'm asking: Where are we stuck? What would count as real progress? Who owns the next step and when? We leave with actions on specific deals (exec intro, MAP agreed, security kicked off) and a couple of minor process tweaks if a stage keeps becoming a parking lot.
In a forecast review, I'm asking: What will close this month/quarter? At what amount and on what date? How confident are we (commit/upside/best case)? What changed since last week? We leave with a clean, defendable number and any downgrades for deals that slipped or lack a concrete follow-up.
Simple rule of thumb: pipeline = how to move, forecast = what we'll land. I don't mix them. Keeping each meeting focused makes coaching sharper and the number more honest.
Free Sales Metrics Calculator
A free, interactive template to calculate your sales KPIs.
- Average Deal Size
- Customer Acquisition Cost (CAC)
- Customer Lifetime Value (CLV)
- And more!
Download Free
All fields are required.
Form not available
How to Clean Up Your Sales Pipeline
I've sat in plenty of pipeline meetings with CRM up on a big screen while we made changes on the fly. Ensuring we keep the CRM up to date as a team is better than relying on reps to update records at their desks and then failing to do so.
My preference is to keep CRM as the single source of truth because when CRM accurately reflects reality, forecasts are more reliable. When it doesn‘t, everything wobbles. Here’s how I clean up a sales pipeline.

1. Review and remove stagnant leads.
If a deal is stagnant or can‘t meet the exit criteria for its stage, it’s time to take action. I move it to nurture or close it out, and I always capture the reason (e.g., no budget owner identified, timing changed, or legal review stalled). If an opportunity has been pending for a while without a clear note, I have the representative call the prospect on the spot — and if it'll help, we make the call together.
How I find stagnant deals fast:
I use CRM filters to surface them in seconds:
- Last activity date (anything beyond 14–21 days with no touch)
- Missing next step or next activity field
- Time in stage (beyond the stage's typical duration)
From there, it‘s one of two paths — remove it, or move it into a nurture sequence if there’s still a signal worth warming up. Most leads won't convert without consistent nurturing. Research shows that 80% of new leads won't convert without nurturing, so a steady, value-led cadence (such as a case study, ROI one-pager, or trial tip) can bring some back to life.
2. Requalify existing leads.
Before I keep a “maybe” in the active pipeline, I re-check fit. Do they still match our ICP? Is the problem live? Do we have a path to a decision maker? I'll run a quick BANT pass and note any gaps. If they don‘t meet the bar, I move them to nurture with a date to revisit — I don’t let them sit in stage and distort the forecast.
Requalifying your leads isn‘t just about weeding out the unqualified ones; it’s also an opportunity to gather fresh information. During this process, you can update outdated contact details, refresh notes on the prospect's pain points, or confirm any new decision-makers.
This ensures a pipeline populated with the most relevant and up-to-date information, which in turn strengthens your sales strategy.
3. Update contact information.
It‘s normal for people to change roles — but that’s also when a lot of good deals die. I make a habit of re-confirming who's actually involved in the buying decision: the day-to-day contact, the person who controls the budget, any technical or legal stakeholders, and the final approver.
If a key decision-maker leaves, I don‘t pretend that nothing changed. I move the deal back to qualification, map the new org chart, and rebuild access — often with a quick "reset" call. If possible, I’ll ask my champion for an introduction to the replacement or reach out to a partner or customer success contact who knows the account.
While I‘m there, I double-check the close date. Does it align with the buyer’s actual timeline? Are we waiting on budget cycles? Legal review? Board approval? If the date is too optimistic, I adjust it and note the reason. If it's too far out, I pull it forward with a mutual action plan (including dates, owners, and milestones) so that both sides agree on what happens next.
I also double-check the opportunity dollar values. Has the scope changed (seats, tiers, term, services)? Are we pricing against a buyer-confirmed configuration or a hopeful placeholder? If we inflate the number, the forecast gets rosy, and we miss. If it‘s too low, we starve the target and panic later. I’d rather be right than optimistic.
This process takes a few minutes: refresh the contacts, reset the stage if leadership has changed, align the date to reality, and update the dollar value to reflect the current scope. It keeps me out of fantasyland and gives the forecast a fighting chance.
4. Follow up with cold leads.
When a deal goes quiet, I don‘t let it sit “active” and hope. I run a short re-engagement sprint where every touch adds something new — a relevant case study, a brief ROI one-pager, or a lightweight mutual action plan — then ask for a simple, dated next step. If there’s still no movement after a handful of thoughtful touches, I re-qualify (did the champion change, is budget timing off, do we have an economic buyer?). If the timing's wrong, I remove it from the active pipeline and place it on nurture with a clear date to revisit.
Pro tip: I use automation tools to streamline routine tasks, such as follow-up emails and data entry. In CRM, I set a workflow that enrolls any opportunity with no reply or next step after X days into a short follow-up sequence, creates a task if there's still no scheduled action, and downgrades the stage if inactivity continues past a threshold.
Automation handles the routine (cadence, reminders, data entry) so I can focus on the reply, the objection, and the next real milestone.
5. Streamline your pipeline stages.
Pipelines bloat over time. Too many stages (or fuzzy ones) slow down deals and confuse everyone. I regularly evaluate and prune so that stages reflect real buyer milestones — not every internal step we take.
Here's how I do it.
- Start with the crux: If two stages hold the same deals for weeks, they're duplicates. I merge or rename them and move the nuance into the playbook or a couple of required fields — not another stage.
- Set clear exit checks (1–3 max): e.g., economic buyer confirmed, success metrics captured, security/legal started. If a deal can‘t meet the checks, it doesn’t advance.
- Avoid “parking lots”: If a stage consistently collects stalled deals, I either fix the definition or remove the stage.
- Branch with checklists, not stages: Enterprise vs. SMB? Don't clone the whole pipeline. Add a short checklist to ensure reps follow the correct path without duplicating stages.
- Audit quarterly, then test for 30 days: Tighten names, collapse redundancy, and run the new definitions for a month before locking them in.
Quick example: We used to have separate stages for “Solution Proposed” and “Proposal Sent.” They behaved the same in practice, so I merged them and added one required field — “Pricing shared and next step agreed (yes/no).” Fewer columns, cleaner data, faster reviews.
Sales Pipeline Analysis: Key Sales Pipeline Metrics to Track
When reviewing your pipeline, you should know some baseline metrics to help determine whether your pipeline is healthy. Use these metrics to gauge the health of your sales pipeline — and, from there, the health of your team, department, and business.
While there are many sales pipeline analysis metrics to consider, I've narrowed it down to six key indicators that provide the most valuable insights for optimizing sales performance and forecasting.
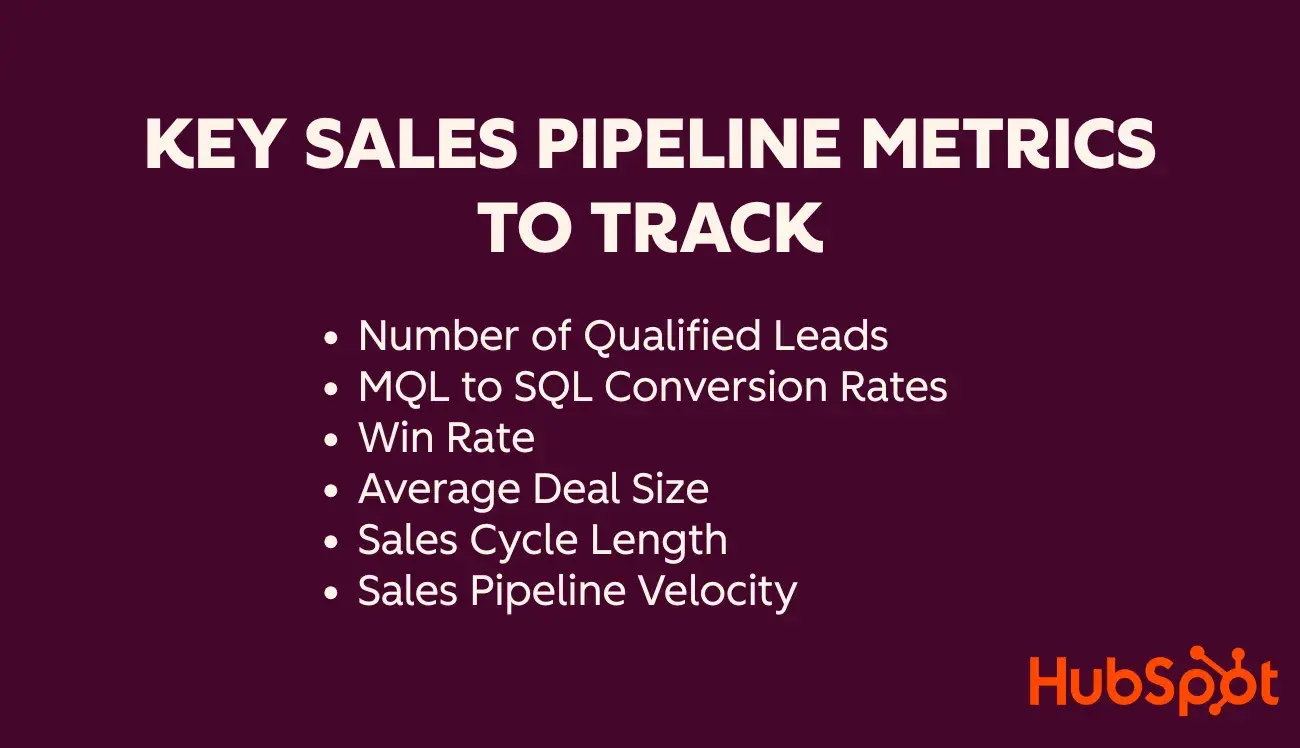
1. Number of Qualified Leads
Tracking the number of qualified leads entering your pipeline each month is crucial. This metric shows if your lead generation efforts are effective. For example, if you receive 200 leads in a month and qualify 50 of them, your qualification rate is 25%.
This metric will help you understand the quality of your leads and adjust your marketing strategies accordingly.
Use this metric to gauge the workload and identify if you have enough opportunities to meet your sales targets.
Pro tip: Ensure the deals are evenly distributed across different stages to prevent bottlenecks.
2. MQL to SQL Conversion Rates
MQL to SQL conversion rate measures the percentage of marketing-qualified leads that become sales-qualified leads. It's a reliable way to assess lead quality and indicates the success of your lead generation campaigns.
The average MQL to SQL conversion rate across popular industries is about 16%. This means that for every 100 MQLs, a marketing campaign should aim to convert at least 16 into SQLs.
To calculate, divide the number of leads that advance by the total number of leads at the initial stage and multiply by 100.
You can use this metric to identify strengths and weaknesses in your sales process and to optimize each stage for better conversion.
3. Win Rate
Win rate measures the percentage of closed deals out of the total opportunities. It helps gauge the effectiveness of your sales process and team performance.
We calculate the win rate percentage by dividing the number of closed deals by the number of leads, opportunities, or meetings. You can also do this for each stage of the sales process.
For example, if you had 50 opportunities and closed 10 deals, your win rate is 20%. This metric indicates your overall sales effectiveness.
4. Average Deal Size
Average deal size indicates the typical value of closed deals.
Formula: Total revenue from all deals / Number of deals. For example, if you have $500,000 in total revenue from 50 deals, the average deal size is $500,000 / 50 = $10,000.
Knowing your average deal size helps you set realistic sales targets and forecasts and can guide your focus toward higher-value opportunities. To increase it, focus on expanding this metric by upselling and cross-selling.
5. Sales Cycle Length
Sales cycle length measures the average time it takes to close a deal from the initial contact to closing.
Formula: Total number of days to close all deals / Number of deals. If it takes 1,000 days to close 50 deals, the average sales cycle length is 1,000 / 50 = 20 days.
This metric helps identify inefficiencies in your sales process and areas for improvement, aiming to shorten the cycle and close deals faster.
6. Sales Pipeline Velocity
Pipeline velocity is one of the key metrics in sales pipeline analysis, measuring the speed at which leads progress through your sales pipeline.
Calculate it using the formula: (Number of Opportunities x Win Rate x Average Deal Size) / Sales Cycle Length.
For instance, suppose you have 50 opportunities in your sales pipeline. Your average win rate is 40%, and your average deal size is $10,000. The sales process usually takes 70 days, from the initial contact to the signed proposal.
Your pipeline velocity = 50 x .4 x 10,000 / 70, or $2,587.14.
That means approximately $2,587.14 is moving through your sales pipeline every day. Obviously, the higher your velocity, the better.
So, how can you increase the pipeline velocity?
You can pull four main levers, and unsurprisingly, they correlate to the four factors of the equation.
- Total opportunities. Increase your prospecting efforts to get more opportunities.
- Win rate. One-on-one weekly coaching helps sales reps deliver high performance. You can improve this metric by investing in sales training and enablement.
- Deal size. Help your reps sell bigger deals by teaching them how to upsell, cross-sell, or target larger customers.
- Sales cycle. Have a well-defined sales process and ensure reps follow it. Leave room to test new strategies, like the growth of AI or buyers' preference for virtual shopping, and adapt accordingly to reduce your sales cycle.
An Easy Sales Pipeline Template
A sales pipeline template lets you set up your pipeline in a spreadsheet. Simply plug in each deal, its expected value, and the probability of closing, and you'll get the weighted average for that deal.
This sales pipeline template also has columns for the assigned salesperson, the prospect's contact information, and the next steps.
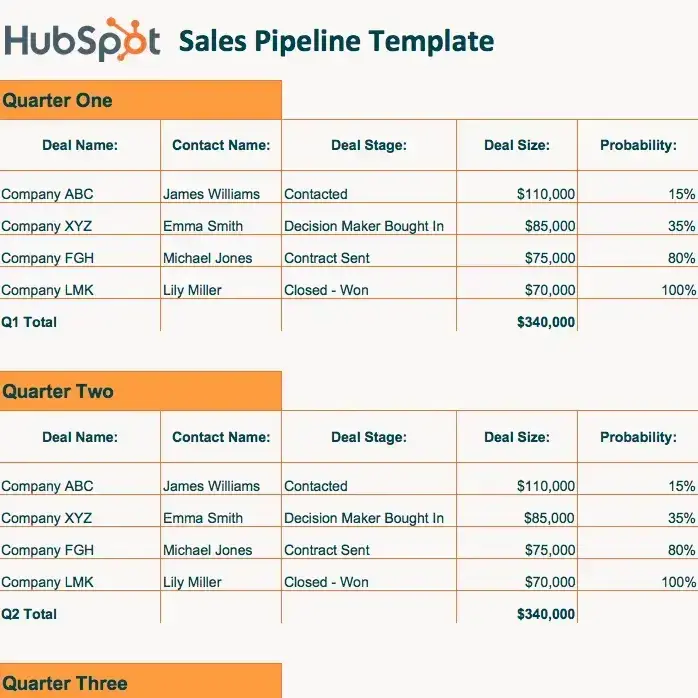
Download HubSpot's Free Sales Pipeline Template
While you can manage your sales pipeline in an Excel spreadsheet, using a CRM is much easier. The HubSpot CRM gives you an up-to-date view of your sales pipeline, multiple ways to sort your deals, automatic activity tracking (so you don't need to log calls or emails manually), and detailed contact records for every lead.
Sales Pipeline Report
The next step in managing your sales pipeline is creating reports. Using reports, you can predict when opportunities will close and get a clearer picture of the pipeline's health. But what should you include in your sales pipeline report?
- The number of opportunities in the pipeline. This is an excellent indicator of whether a pipeline has enough opportunities to meet revenue goals and quotas.
- Opportunity sizes. If an opportunity closes, how much value will it provide to the sales team?
- Close date for each opportunity. This tells you when an opportunity might close. It also allows salespeople and managers to forecast expected revenue.
- An overview of the pipeline over time. Is your pipeline growing? Zooming out and looking at the pipeline history will show you the answer.
Ready for sales pipeline management?
I‘ve learned the hard way that a pipeline isn’t a spreadsheet to admire — it's a living system you tune every week.
What has worked for me is simple, not easy: build stages around how buyers actually make decisions, keep CRM as the single source of truth, run short and honest reviews that end with real next steps, and clean as you go so the numbers reflect reality. When my pipeline is healthy, I can identify risks early, coach with purpose, and forecast with confidence.
Editor's note: This post was originally published in June 2017 and has been updated for comprehensiveness.
Free Sales Metrics Calculator
A free, interactive template to calculate your sales KPIs.
- Average Deal Size
- Customer Acquisition Cost (CAC)
- Customer Lifetime Value (CLV)
- And more!
Download Free
All fields are required.
Form not available
![Modern sales orgs are leaning into marketing behaviors — here's what that means for you [new data]](https://53.fs1.hubspotusercontent-na1.net/hubfs/53/sales-team-marketing-behaviors-1-20251117-5976195.webp)
![Why your sales enablement content needs real-world credibility [new data]](https://53.fs1.hubspotusercontent-na1.net/hubfs/53/sales-enablement-content-credibility-1-20251028-1482008.webp)


.webp)

.png)