
.png?width=112&height=112&name=Image%20Hackathon%20%E2%80%93%20Vertical%20(85).png)

Customer success objectives and key results (OKRs) turn priorities such as retention, satisfaction, onboarding, and expansion into measurable quarterly goals. This guide explains how to establish baselines, write useful key results, and track progress with Service Hub, HubSpot’s customer service software.
![→ Download Now: Customer Service Metrics Calculator [Free Tool]](https://no-cache.hubspot.com/cta/default/53/e24dc302-9dc2-466f-a5ca-ab4e08633c0f.png)
I'll also share customer success OKR examples for each stage of the customer lifecycle and show how HubSpot’s free Customer Service Metrics Calculator can help teams establish starting points.
What are customer success OKRs and how are they different from KPIs?
Customer success OKRs are outcome-based goals that help customer success teams drive measurable change in retention, satisfaction, onboarding, and expansion within a defined period, typically a quarter. Each OKR pairs one qualitative objective with two to four quantitative key results that define success.
Andy Grove developed the OKR methodology at Intel and taught it to John Doerr. Doerr introduced it to Google’s founders in 1999. Teams can express the framework with a simple formula: “I will [objective] as measured by [key results].” That structure requires a team to state both the outcome it wants and the evidence that will show progress. For a broader look at team operations, see HubSpot’s guide to customer success best practices.
OKRs vs. KPIs: What is the actual difference?
Customer success OKRs set targets for change, while key performance indicators (KPIs) monitor ongoing performance. A KPI shows a customer success (CS) leader where the team stands. An OKR states where the team needs to go, by when, and how the team will measure progress.
For example, a monthly customer churn rate of 4.2% reflects the current state. It does not assign an owner, set a target, or establish a deadline. An OKR can add all three.
What Matters calls OKRs “KPIs with soul” because they add direction and purpose to metrics. The two frameworks complement each other: KPIs monitor operational health, and OKRs organize focused change. HubSpot’s customer success metrics guide explains the metrics that can feed customer success OKRs.
My take: I saw this distinction firsthand when I built an OKR framework at Greenhouse Software. Writing measurable key results was not the hardest part. The harder task was connecting each key result to a business objective that mattered. If a team can achieve a key result while the business still misses the outcome that prompted it, the team chose the wrong key result.
Both frameworks belong in a CS operating model. KPIs show whether the operation remains healthy; OKRs focus the team on a specific improvement.
Pro tip: A standing KPI can become a key result when the team wants to change it. If monthly customer churn is 4.2%, write the OKR this way:
- Objective: Reduce preventable customer churn.
- Key result: Reduce monthly customer churn from 4.2% to 2.8% by the end of Q3.
The KPI supplies the metric. The OKR includes a target, a deadline, and a mandate.
.png)
Free Customer Service Metrics Calculator
Calculate your business's key metrics and KPIs for customer support, service, and success with this free template.
- Customer Acquisition Cost
- Customer Lifetime Value
- Customer Satisfaction Score
- And More!
Download Free
All fields are required.
Form not available
Customer Success OKRs for Retention
Retention OKRs focus customer success teams on keeping customers and recurring revenue. Retention OKRs often use key results such as customer churn, customer health score, and renewal rate. Strong retention key results name a current baseline, target, deadline, owner, and reporting cadence.
Churn Rate
Customer churn rate measures the percentage of customers who cancel during a defined period. Divide the number of customers lost during the period by the number of customers at the start of the period, then multiply by 100.
Recurly’s current churn benchmarks indicate an average churn rate of 3.8% for business-to-business (B2B) software and business and professional services. Compare that figure with caution: Contract length, customer segment, and whether a team measures customer or revenue churn can all change the benchmark.
Customer Success OKR Example for Churn Rate
- Objective: Reduce customer churn among small and medium-sized business (SMB) accounts.
- Key result 1: Reduce monthly SMB customer churn from 4.8% to 3.2% by the end of Q3.
- Key result 2: Configure automated health-score alerts for every SMB account that crosses the team’s at-risk threshold by week two of Q3.
- Key result 3: Contact 90% of newly at-risk SMB accounts within five business days after the alert.
Best for: Software-as-a-service (SaaS) teams that serve many SMB accounts and can act on automated risk signals with repeatable interventions.
Customer Health Score
A customer health score combines signals such as product usage, support history, customer feedback, engagement, and payment history into one indicator of account risk or expansion readiness. Teams can display the result as red, yellow, or green or use a numeric scale such as 0 to 100.
Use health scores as leading indicators, not universal truth. Set signal weights and thresholds from the company’s own retention data, then test whether at-risk scores actually preceded churn. For a 0-to-100 model, define each band from those results instead of copying another company’s cutoffs.
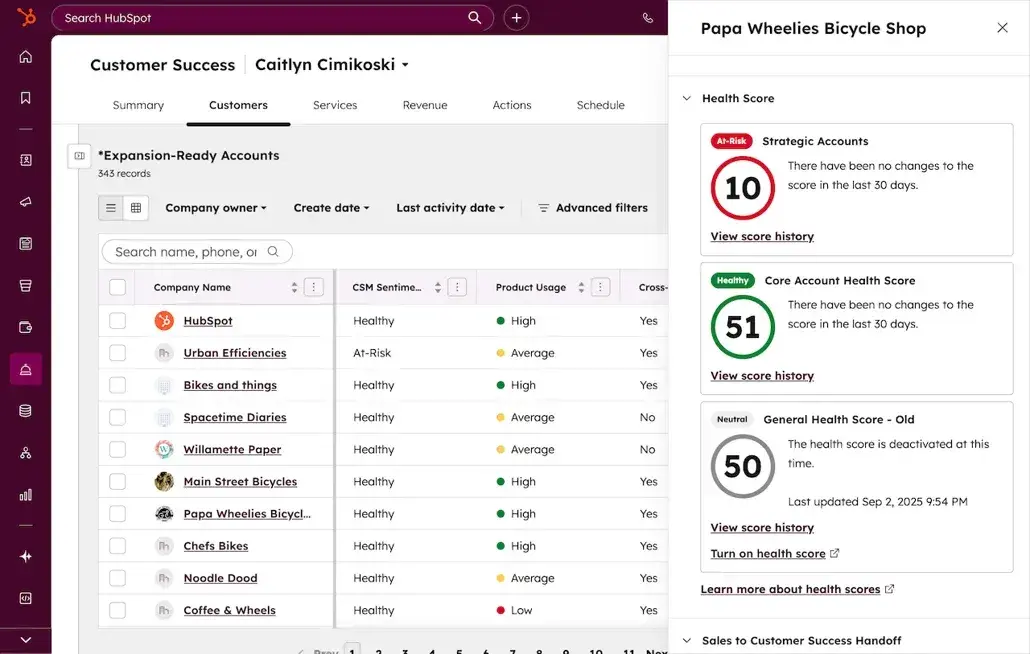
Use health scores as leading indicators, not universal truth. Set signal weights and thresholds from the company’s own retention data, then test whether at-risk scores actually preceded churn. For a 0-to-100 model, define each band from those results instead of copying another company’s cutoffs.
Customer Success OKR Example for Customer Health Score
- Objective: Improve customer health across enterprise accounts.
- Key result 1: Increase the percentage of enterprise accounts in the validated healthy band from 52% to 70% by the end of Q2.
- Key result 2: Reduce the percentage of enterprise accounts in the validated critical-risk band from 18% to 8% by the end of Q2.
- Key result 3: Create a documented intervention plan within five business days for every enterprise account that enters the critical-risk band.
Pro tip: Health scores fail when teams weight signals that do not predict outcomes. Product usage can carry more or less weight depending on the product, customer segment, and lifecycle stage. Run the model for two quarters, compare past scores with churn and renewal outcomes, and use the audit to refine the signals and weights.
Renewal Rate
Renewal rate measures the percentage of contracts that customers renew at the end of their terms. Divide the number of renewed contracts by the number of contracts eligible for renewal, then multiply by 100. Revenue-weighted renewal rate compares the value of renewed contracts to the value eligible for renewal, providing teams with useful context when contract sizes vary widely.
Forrester reports that existing customers account for 61% of B2B revenue through renewals and expansions. That share makes renewal performance a material business outcome, although a team should still set its target from its own segment and contract baselines. HubSpot’s overview of customer success team structure can help leaders assign renewal ownership across customer success manager (CSM) roles.
Customer Success OKR Example for Renewal Rate
- Objective: Protect and grow renewal revenue in the mid-market segment.
- Key result 1: Achieve a 92% customer renewal rate for mid-market accounts in Q3.
- Key result 2: Achieve a 96% revenue-weighted renewal rate for mid-market accounts in Q3.
- Key result 3: Complete renewal-risk assessments for every mid-market contract at least 90 days before its renewal date.
What we like: HubSpot’s customer success workspace brings health score trends, product usage, support history, renewal pipeline, tasks, and CRM data into a single account view. CS managers can review the renewal pipeline and the context behind each account before the final weeks of a contract.
Customer Success OKRs for Satisfaction
Satisfaction OKRs focus teams on how customers rate a product, service, or support interaction. Common key results include Net Promoter Score (NPS), customer satisfaction score (CSAT), survey response rate, first response time, and resolution time. Segment the results by account tier or lifecycle stage, then use the team’s baseline to set a realistic target.
Net Promoter Score (NPS)
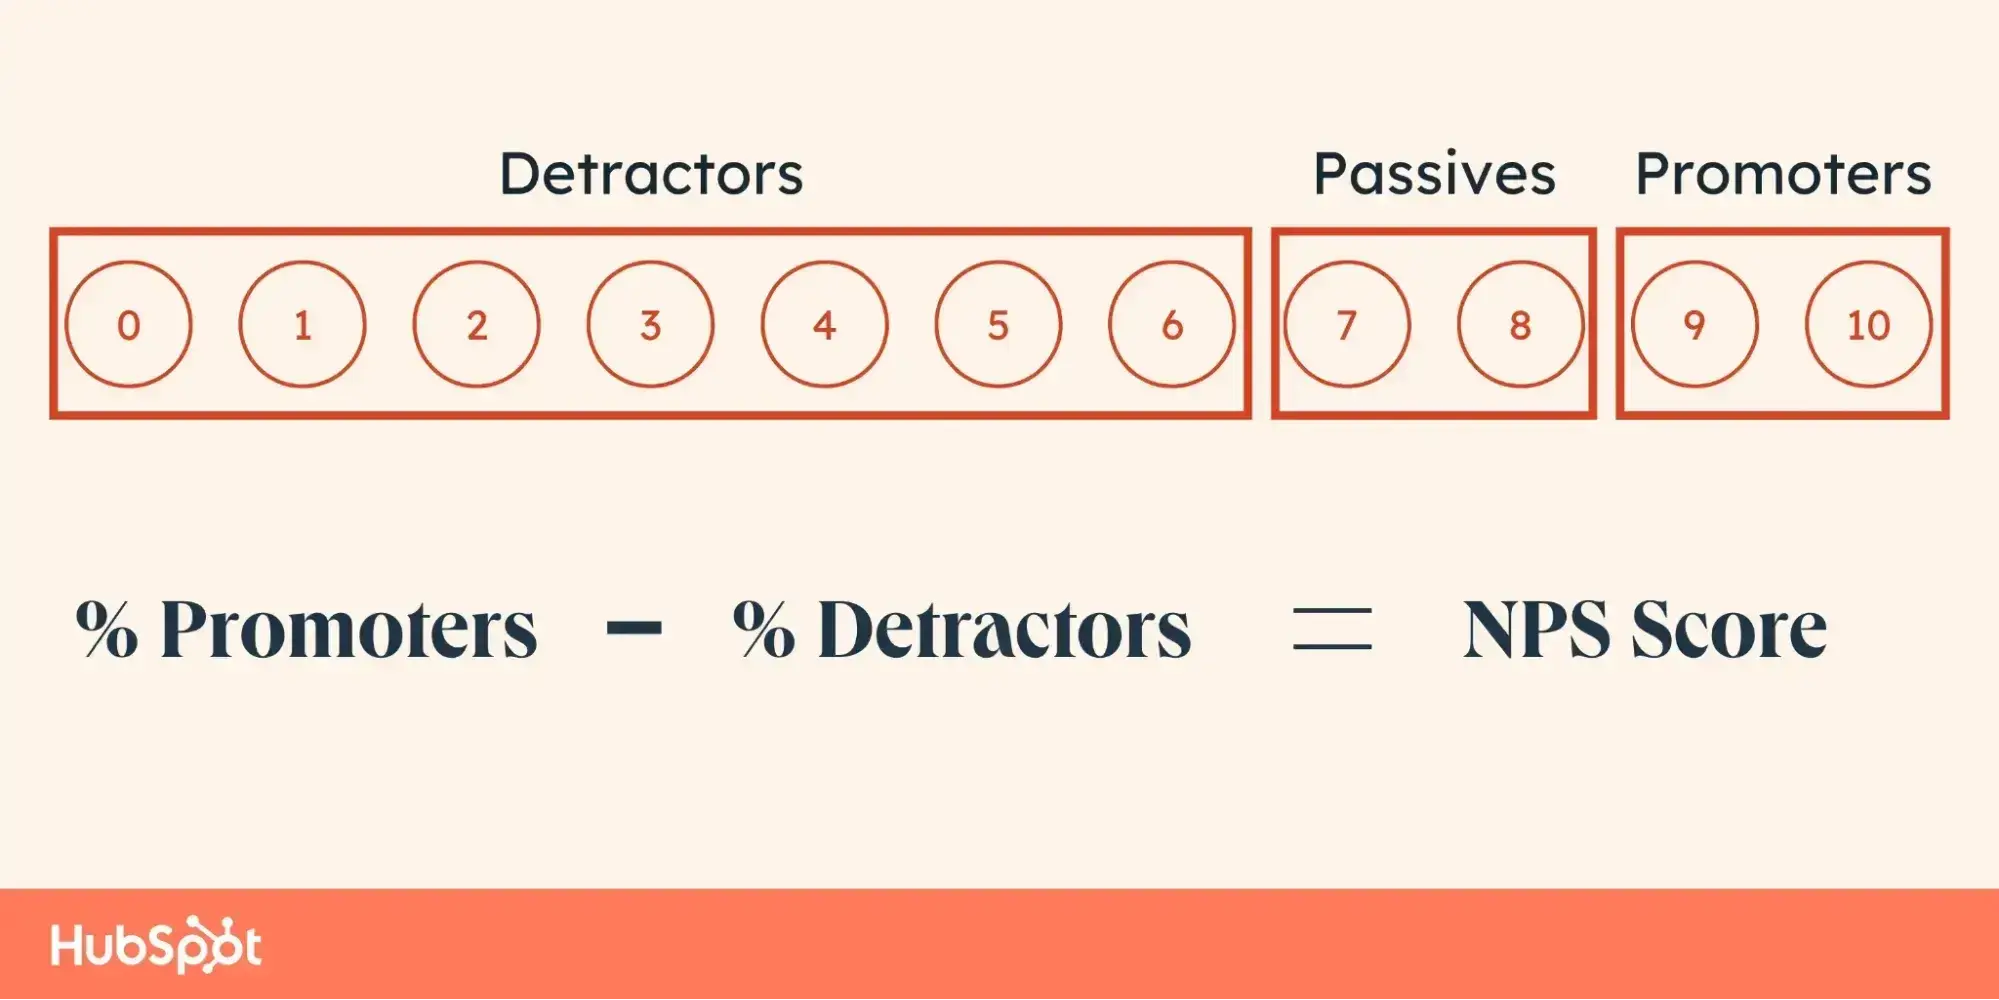
NPS measures relationship-level loyalty by asking customers how likely they are to recommend a company, product, or service on a scale from 0 to 10. Promoters select 9 or 10, passives select 7 or 8, and detractors select 0 through 6. Subtract the percentage of detractors from the percentage of promoters to calculate a score from −100 to 100.
Retently’s 2026 NPS benchmark puts the average score for B2B software and SaaS companies at 41. Treat that figure as context, not a universal target; compare each segment with its own baseline.
NPS becomes more useful when CS teams segment it by account tier, product line, or lifecycle stage. A blended score can hide an enterprise segment with many promoters and an SMB segment with many detractors. Segment-level key results make those differences visible and support distinct follow-up plans.
Customer Success OKR Example for NPS
- Objective: Strengthen customer loyalty among mid-market accounts.
- Key result 1: Increase mid-market NPS from 34 to 44 by the end of Q3.
- Key result 2: Reduce the detractor rate among mid-market accounts from 22% to 12% by the end of Q3.
- Key result 3: Increase the mid-market NPS survey response rate from 21% to 35% through improved timing and delivery by the end of Q3.
Pro tip: When I launched the NPS program at Skybound Entertainment, I had no baseline. I surveyed recent buyers after purchase within a consistent engagement window and repeated the cycle until we had enough data to establish one. Our first stable NPS exceeded 45 even though CSAT was lower. That difference reinforced that the metrics answer different questions: NPS reflects relationship-level loyalty, while CSAT measures satisfaction with a specific interaction. Track them separately.
Customer Satisfaction Score (CSAT)
CSAT measures satisfaction with a specific interaction, such as a support resolution or onboarding session. Divide the number of positive responses — usually ratings of 4 or 5 on a five-point scale — by the total number of responses, then multiply by 100.

Retently’s 2026 CSAT benchmark places B2B software and SaaS companies in the high 70s. Use that range as context and set the OKR target from the team’s own baseline. Pair CSAT with response-time metrics so the team can test whether faster replies or resolutions correlate with satisfaction in its own data.
Customer Success OKR Example for CSAT
- Objective: Improve post-interaction satisfaction across support.
- Key result 1: Increase overall CSAT from 76% to 85% by the end of Q2.
- Key result 2: Reduce average first response time from 6.2 hours to less than two hours by the end of Q2.
- Key result 3: Report CSAT by resolution-time band for every support ticket that receives a survey response by the end of Q2.
What we like: HubSpot’s service analytics reports let CS leaders track customer satisfaction, ticket volume, and response times without having to create every report manually. Teams can apply filters, compare trends over time, and save reports to a dashboard for weekly OKR reviews.
Survey Response Rate and Score by Segment
Survey response rate measures the percentage of invited customers who complete an NPS or CSAT survey. Survicate’s 2025 benchmark report found that SaaS surveys had a median response rate of 7.74%. Use channel and segment context rather than treating a single response-rate cutoff as universal, and check whether respondents resemble the full invited population.
Segment scores by account tier, product line, or lifecycle stage to turn aggregate satisfaction data into specific action. Enterprise and SMB detractors may need different follow-up because account value, service model, and available channels differ. Segment-level OKRs keep those differences visible.
Customer Success OKR Example for Response Rate and Segmentation
- Objective: Build a representative satisfaction dataset across the customer base.
- Key result 1: Increase the NPS survey response rate from 18% to 30% by the end of Q1 through improved send timing and survey format.
- Key result 2: Establish NPS baselines for enterprise, mid-market, and SMB accounts by the end of Q1.
- Key result 3: Identify the three interaction types that drive the most detractor responses in each segment by the end of Q1.
Free Customer Service Metrics Calculator
Calculate your business's key metrics and KPIs for customer support, service, and success with this free template.
- Customer Acquisition Cost
- Customer Lifetime Value
- Customer Satisfaction Score
- And More!
Download Free
All fields are required.
Form not available
Customer Success OKRs for Onboarding
Onboarding OKRs focus teams on helping new customers reach a meaningful outcome quickly and consistently. Common key results include activation rate, time to first value, onboarding completion rate, milestone attainment, and escalation rate. HubSpot’s customer onboarding guide explains how to design the broader process that these OKRs measure.
Activation Rate
Activation rate measures the percentage of new customers who complete an action that signals meaningful product value. A CRM might count the import of contacts and the logging of a first activity. A support platform might count resolving a first ticket after the team configures ticket routing in HubSpot’s help desk.
Userpilot’s 2025 SaaS Product Metrics Benchmark Report found an average activation rate of 37.5% across 62 B2B companies. Because each product defines activation differently, use that figure as directional context and validate the event against retention in the company’s own data.
Customer Success OKR Example for Activation Rate
- Objective: Increase product activation among new customers during their first 30 days.
- Key result 1: Increase the 30-day activation rate from 29% to 42% by the end of Q2.
- Key result 2: Validate one activation event for each product tier by comparing 90-day retention for customers who did and did not complete it by week four of Q2.
- Key result 3: Reduce the median time from account creation to activation from 5.2 days to two days by the end of Q2.
Time to First Value
Time to first value (TTFV) measures the elapsed time between sign-up or the start of onboarding and a customer’s first meaningful outcome. It shows how quickly onboarding helps new customers realize the product’s value. Because each product defines value differently, teams should compare TTFV within a consistent segment and event definition.
Userpilot’s 2025 benchmark report found an average TTFV of one day, 12 hours, and 23 minutes across 62 B2B SaaS companies. Use the report’s industry-specific ranges as context instead of treating the overall average as a universal target.
Customer Success OKR Example for Time to First Value
- Objective: Help new enterprise accounts reach their first meaningful outcome sooner.
- Key result 1: Reduce median TTFV for enterprise onboarding from 11 days to five days by the end of Q3.
- Key result 2: Help 60% of new enterprise accounts reach first value in less than three days by the end of Q3.
- Key result 3: Build and launch a guided enterprise-onboarding playbook by week two of Q3.
Pro tip: At a previous digital media company, I reduced partner TTFV by 45% by reorganizing documentation, creating feedback loops with engineering, and using high-touch onboarding. Documentation led to the biggest improvement because partners could resolve common setup issues without waiting for a response. If TTFV stalls, audit the documentation first.
Onboarding Completion Rate
Onboarding completion rate measures the percentage of new customers who complete all required steps in the defined onboarding process. A low completion rate can reveal too many steps, unclear instructions, or misaligned expectations during the sales-to-CS handoff.
Userpilot’s 2025 benchmark report found an average onboarding-checklist completion rate of 19.2% across 188 B2B SaaS companies. A checklist does not represent an entire onboarding program, but the low completion benchmark shows why teams should measure where customers stop and which steps they skip.
Customer Success OKR Example for Onboarding Completion Rate
- Objective: Improve the consistency and completion of the new-customer onboarding process.
- Key result 1: Increase the onboarding completion rate from 61% to 80% by the end of Q2.
- Key result 2: Reduce average onboarding time from 18 days to 10 days by the end of Q2.
- Key result 3: Maintain an average post-onboarding CSAT of at least 4.4 out of 5 through the end of Q2.
Milestone Attainment and Escalation Rate
Milestone attainment tracks whether customers complete defined onboarding checkpoints, such as connecting an integration, adding a second user, or publishing first content. Escalation rate measures the percentage of new customers who require intervention from a senior CSM or the support team because the standard process did not resolve the problem.
Each escalation consumes senior-staff time and can reveal friction in the standard onboarding flow. Pairing milestone attainment with escalation rate helps a team test whether clearer checkpoints and better self-service reduce avoidable intervention without lowering satisfaction.
Customer Success OKR Example for Milestone Attainment and Escalation Rate
- Objective: Build a more self-sufficient onboarding experience that requires less CSM intervention.
- Key result 1: Increase the percentage of customers who complete all three core onboarding milestones from 48% to 72% by the end of Q2.
- Key result 2: Reduce onboarding-related escalations by 35% from the current baseline through clearer documentation and proactive milestone check-ins by the end of Q2.
- Key result 3: Reduce average CSM time per onboarding by 25% through a standardized first-30-day playbook by the end of Q2.
Best for: Growth-stage SaaS teams that rely on CSM-led onboarding and need to serve more new customers without increasing CSM time at the same rate.
Customer Success OKRs for Expansion
Expansion OKRs focus customer success teams on growing recurring revenue and product adoption within existing accounts. Expansion OKRs often use key results such as expansion monthly recurring revenue (MRR), net revenue retention (NRR), and multi-product adoption. Set each target from a segment-specific baseline because contract value, product mix, and the company’s expansion process can vary widely.
Expansion MRR
Expansion MRR measures new monthly recurring revenue from existing customers through upgrades, add-ons, and cross-sells. It excludes revenue from new customers and shows how much recurring growth the existing customer base generates.
Customer Success OKR Example for Expansion MRR
- Objective: Grow recurring revenue from healthy mid-market accounts.
- Key result 1: Increase expansion MRR from mid-market accounts from $180k to $250k by the end of Q3.
- Key result 2: Document at least one qualified expansion use case for 90% of mid-market accounts in the healthy band by the end of Q3.
- Key result 3: Convert 25% of qualified mid-market expansion opportunities by the end of Q3.
Best for: Teams that assign CS clear responsibility for identifying or supporting upgrades and cross-sells within existing accounts.
Net Revenue Retention
NRR measures the recurring revenue a company retains from existing customers after expansion, contraction, and churn. Add expansion revenue to starting recurring revenue, subtract contraction and churned revenue, divide by starting recurring revenue, and multiply by 100.
Customer Success OKR Example for Net Revenue Retention
- Objective: Increase recurring revenue retained from mid-market customers.
- Key result 1: Increase mid-market NRR from 101% to 108% by the end of Q4.
- Key result 2: Reduce mid-market contraction MRR from $70k to $45k by the end of Q4.
- Key result 3: Increase mid-market expansion MRR from $180k to $240k by the end of Q4.
Best for: Subscription businesses that need one metric to reflect renewals, downgrades, churn, and account expansion.
Multi-Product Adoption
Multi-product adoption rate measures the percentage of eligible customers who actively use two or more products. Define “active” using product-specific usage events so the metric reflects customer value rather than purchases customers never use.
Customer Success OKR Example for Multi-Product Adoption
- Objective: Help enterprise customers gain value from more of the product portfolio.
- Key result 1: Increase multi-product adoption among eligible enterprise accounts from 28% to 40% by the end of Q3.
- Key result 2: Identify the next relevant product use case for every healthy enterprise account by the end of Q3.
- Key result 3: Help 80% of newly expanded enterprise accounts complete the defined activation event for the added product within 30 days of purchase.
Best for: Companies with multiple products or paid add-ons that can measure whether customers adopt what they buy.
How to Set Customer Success OKRs Step by Step
Set customer success OKRs in five steps: connect the objective to a business priority, establish the baseline, write measurable key results, assign one owner to each key result, and define the review cadence. Following the sequence keeps the framework focused on business outcomes rather than on the metrics the team already tracks.
Step 1: Anchor the OKR to the business objective.
Connect every customer success OKR to a company priority. If the company wants to reduce churn by 30%, the CS team should choose at least one objective that supports that outcome. If the company prioritizes expansion revenue, the CS team should include expansion MRR or NRR in the relevant key results.
Do not choose CS objectives in isolation from the broader strategy. A CS team can achieve every key result and still miss the company’s outcome when the objectives reflect internal preferences rather than business priorities.
My take: When I built the broader customer experience OKR framework at Skybound Entertainment, I organized five objectives around different parts of the business and assigned each a clear owner. Every objective supported the same company outcome: protecting brand trust while growing revenue without increasing headcount at the same rate. That connection turned the framework from a metric list into a map of the outcomes the customer experience team could influence.
Step 2: Establish the baseline.
Teams need a current baseline before they can set a meaningful target. Use the current reporting system when it contains consistent historical data.
If historical data is incomplete, define the audience, measurement window, method, and minimum response threshold before the first cycle. Treat that cycle as the baseline, then use the same method in the next quarter to keep the comparison valid.
Step 3: Write key results that the team can measure.
Key results should include a baseline, a target, a deadline, an owner, and a reporting cadence. Without those details, teams cannot tell whether progress matches the plan or who should act.
Write each key result with a number and direction. “Improve NPS” is not measurable. “Increase mid-market NPS from 34 to 39 by the end of Q3, with the CS operations lead reviewing it monthly” gives the team a baseline, target, deadline, owner, and cadence. Hard thresholds and relative-improvement targets can both work, but the team must use a consistent formula and data source.
My take: At Skybound, the key results that most clearly changed behavior used hard thresholds and named owners: achieve at least 65% first-contact resolution, keep average resolution time at 72 hours or less, and automate 30% of repeat ecommerce inquiries. Relative-improvement targets created confusion when the team had not established formal baselines. Establish the baseline first, then set the target.
Step 4: Assign one owner to each key result.
Assign one accountable owner to each key result. Multiple teams can contribute to the work, but one person should track progress, identify blockers, and report status.
Match ownership to the person who controls the work and can coordinate contributors. A CSM lead might own health-score and renewal targets, an onboarding lead might own TTFV and completion targets, and a support operations manager might own CSAT and response-time targets. A cross-functional objective can span teams, but each key result still needs one accountable owner.
Step 5: Set the review cadence.
Review customer success OKRs weekly at the team level. At the quarter’s midpoint, reassess any target whose assumptions have materially changed. Weekly reviews give teams time to intervene, while midquarter resets keep targets relevant when product, market, or company priorities shift.
The weekly review can remain brief. Give each key result a five-minute status update and identify any blockers. For frameworks with multiple objectives, add a monthly leadership review covering cross-functional progress and dependencies.
How to Track Customer Success OKRs in HubSpot
Track customer success OKRs in HubSpot by pairing each key result with a goal, report, or CRM property that measures it. The Goals tool stores selected service and custom targets, while service analytics, customer feedback, the help desk, the customer success workspace, and custom reports supply the underlying data. Use the same formula, filters, segment, and date range throughout the quarter.
Start with this tool-to-metric map:
HubSpot Goals
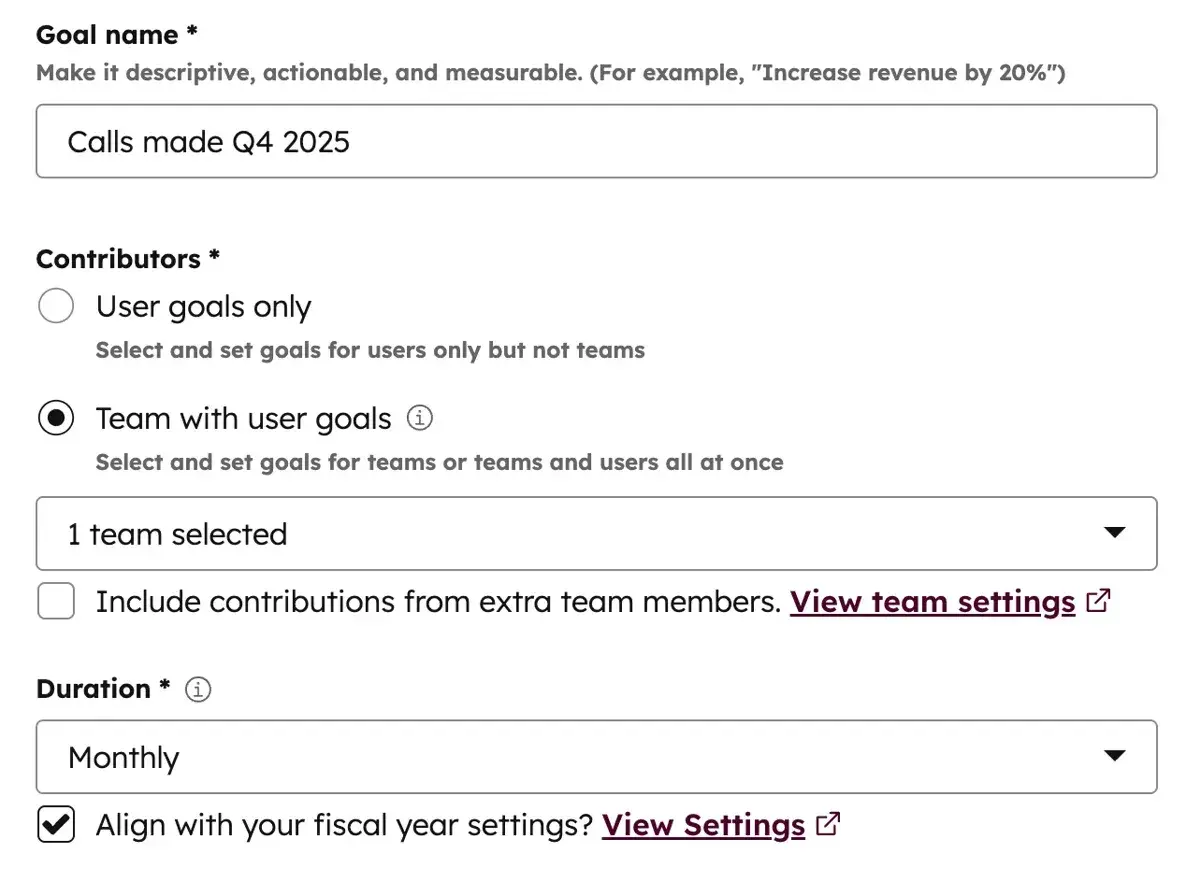
HubSpot Goals lets teams create service or custom targets and review progress over time. Service goal templates cover measures such as average ticket response time, average ticket resolution time, and the number of tickets closed. Custom goals can use properties and aggregations from records such as companies, contacts, conversations, deals, and tickets.
Create one goal for each key result that maps cleanly to an available metric. Keep the qualitative objective and any work that HubSpot cannot measure in the team’s OKR record, then save a goal-performance report to the OKR dashboard.
Key Features
- Service goal templates: Set targets for supported service measures such as response time, resolution time, and tickets closed.
- Custom goals: Build team or user goals from supported CRM objects, properties, and aggregation methods.
- Goal reporting: Compare actual progress with the target and save goal reports to a dashboard.
Best for: Service Hub Professional and Enterprise teams that want targets and performance reporting in the same system as their service data.
Pricing: HubSpot includes goal creation and reporting with Service Hub Professional and Enterprise. Professional starts at $90 per seat per month, plus a one-time $1,500 onboarding fee. Enterprise starts at $150 per seat per month, plus a one-time $3,500 onboarding fee.
What we like: Goals add the target and time period that a dashboard metric alone lacks. They work especially well for response-time and resolution-time key results that already match a service goal template.
Service Analytics
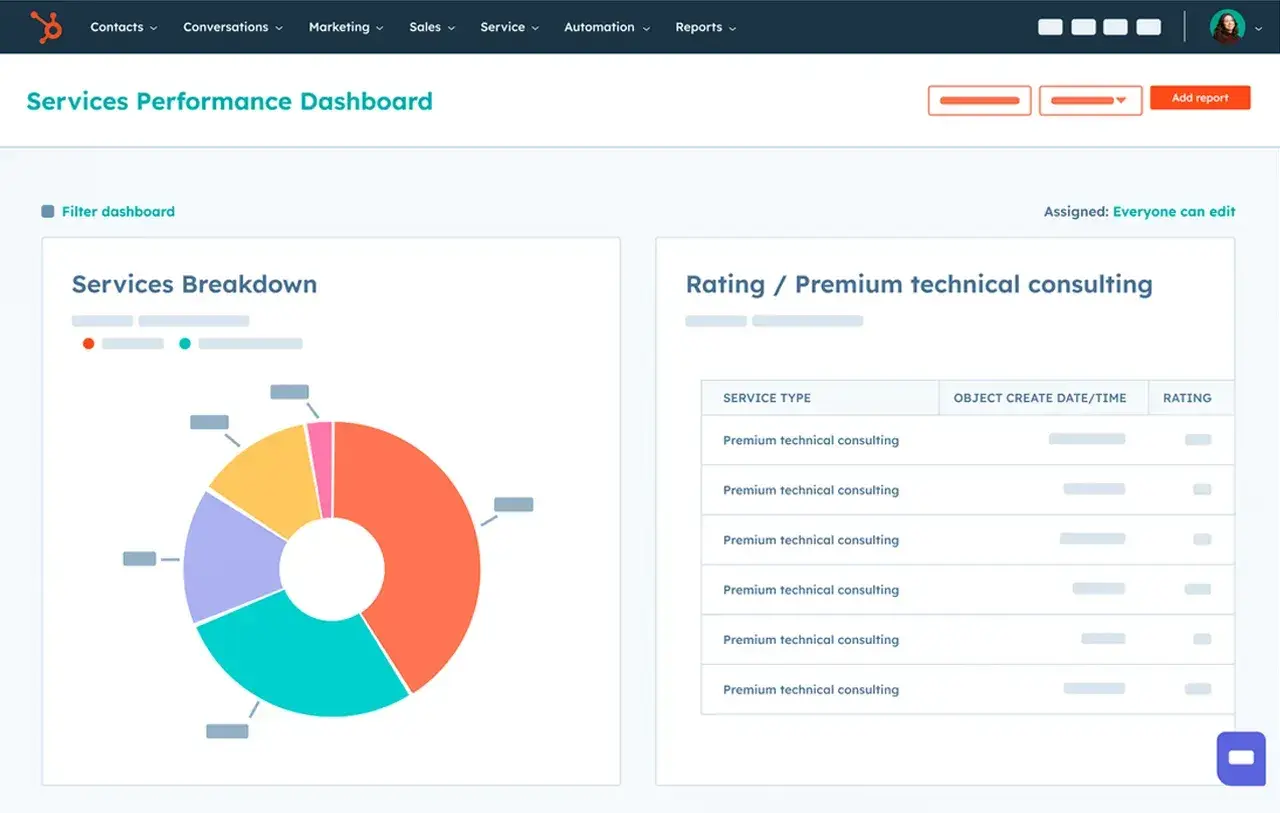
Service analytics provides prebuilt reports for customer satisfaction, average ticket response time, support volume, and other service measures. To open it, go to More > Reporting > Reports, then select Service in the left sidebar. HubSpot’s service analytics documentation explains how teams can filter compatible reports, switch between totals and trends, customize them, and save them to a dashboard.
Service analytics does not provide every metric named in an OKR. Use customer feedback for NPS surveys, the customer success workspace for health and renewal context, and custom reports for product-specific onboarding events.
Key Features
- Prebuilt service reports: Start with reports for CSAT, ticket response time, support volume, and team performance.
- Trend and total views: Compare movement over time with the current aggregate on compatible reports.
- Dashboard saving: Customize a report, then save it to the team’s customer success OKR dashboard.
Best for: CS and support leaders who track satisfaction, responsiveness, and workload key results.
Pricing: HubSpot includes service analytics with Service Hub Starter, Professional, and Enterprise plans. Starter starts at $7 per seat per month, Professional starts at $90 per seat per month, and Enterprise starts at $150 per seat per month. HubSpot charges one-time onboarding fees of $1,500 for Professional and $3,500 for Enterprise.
What we like: The prebuilt reports reduce setup work, while filters let a team keep the account segment and reporting period consistent with the OKR definition.
Help Desk
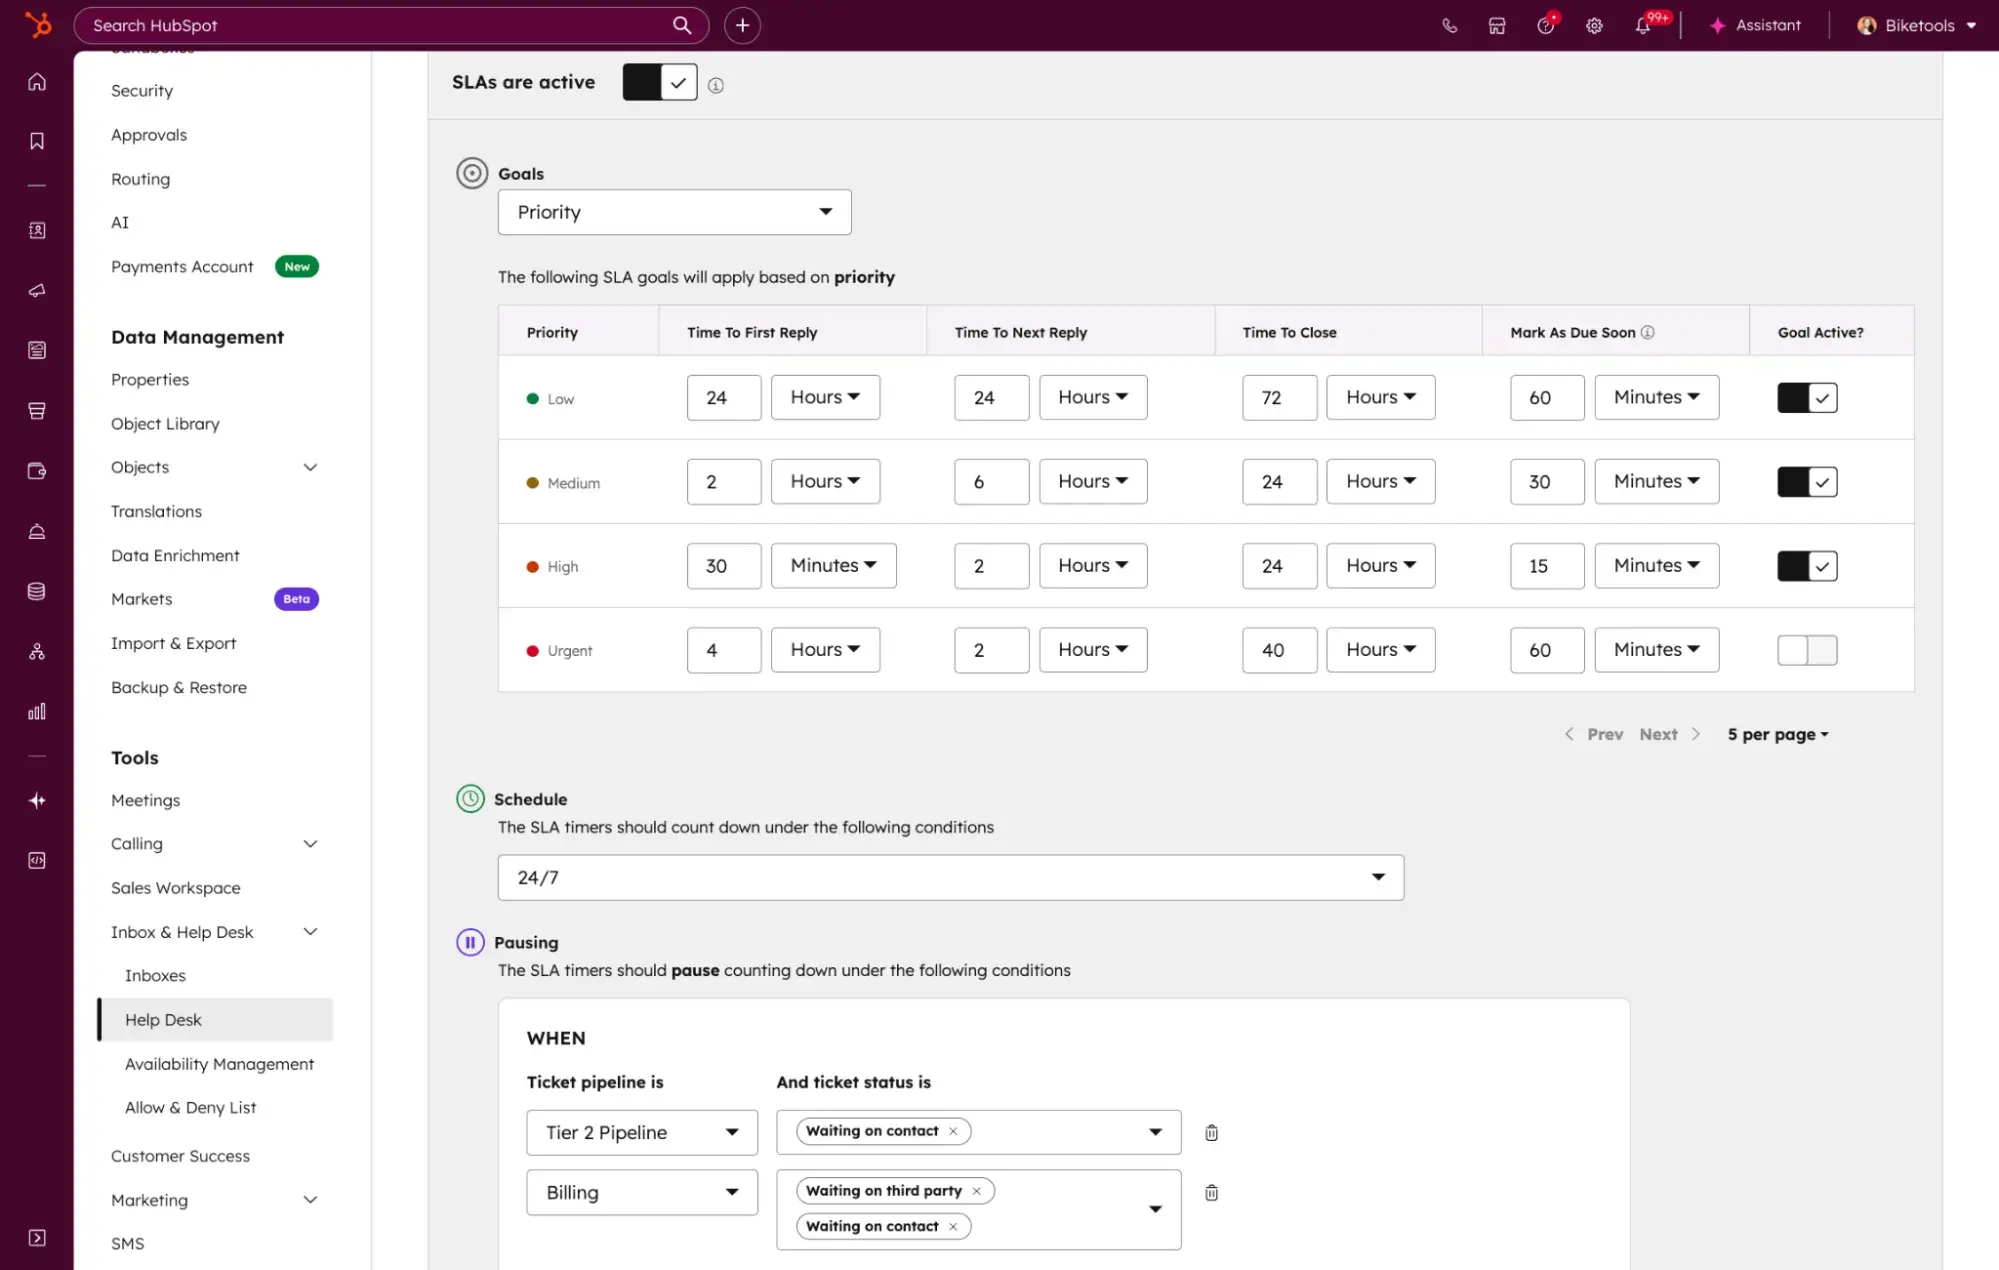
Help desk centralizes support tickets and their associated conversations. CS and support teams can assign tickets, manage status and priority, review customer and company context, and use ticket data in response-time, resolution-time, and volume key results.
Accounts that need automatic ticket assignment can route incoming help desk tickets to specific users or teams, use an assignment workflow, assign a contact owner, or apply supported distribution rules. HubSpot requires Service Hub Professional or Enterprise, along with a Service Seat, to use the documented automatic-routing features.
Key features:
- Unified ticket workspace: Review the conversation, ticket properties, associated records, and activity history in one place.
- Ticket routing: Assign incoming tickets by user, team, workflow, contact owner, or supported distribution rule.
- Operational reporting: Use help desk ticket and reply data in service analytics and custom reports.
Best for: Teams that use response time, resolution time, first-contact resolution, or ticket volume as key results.
Pricing: HubSpot offers select help desk functionality for free, with additional features available in paid Service Hub editions. Automatic routing requires Professional or Enterprise. Professional starts at $90 per seat per month, plus a one-time $1,500 onboarding fee. Enterprise starts at $150 per seat per month, plus a one-time $3,500 onboarding fee.
What we like: The help desk connects each operating metric to the ticket and customer context behind it, helping teams diagnose why a key result changed.
Conversations Inbox
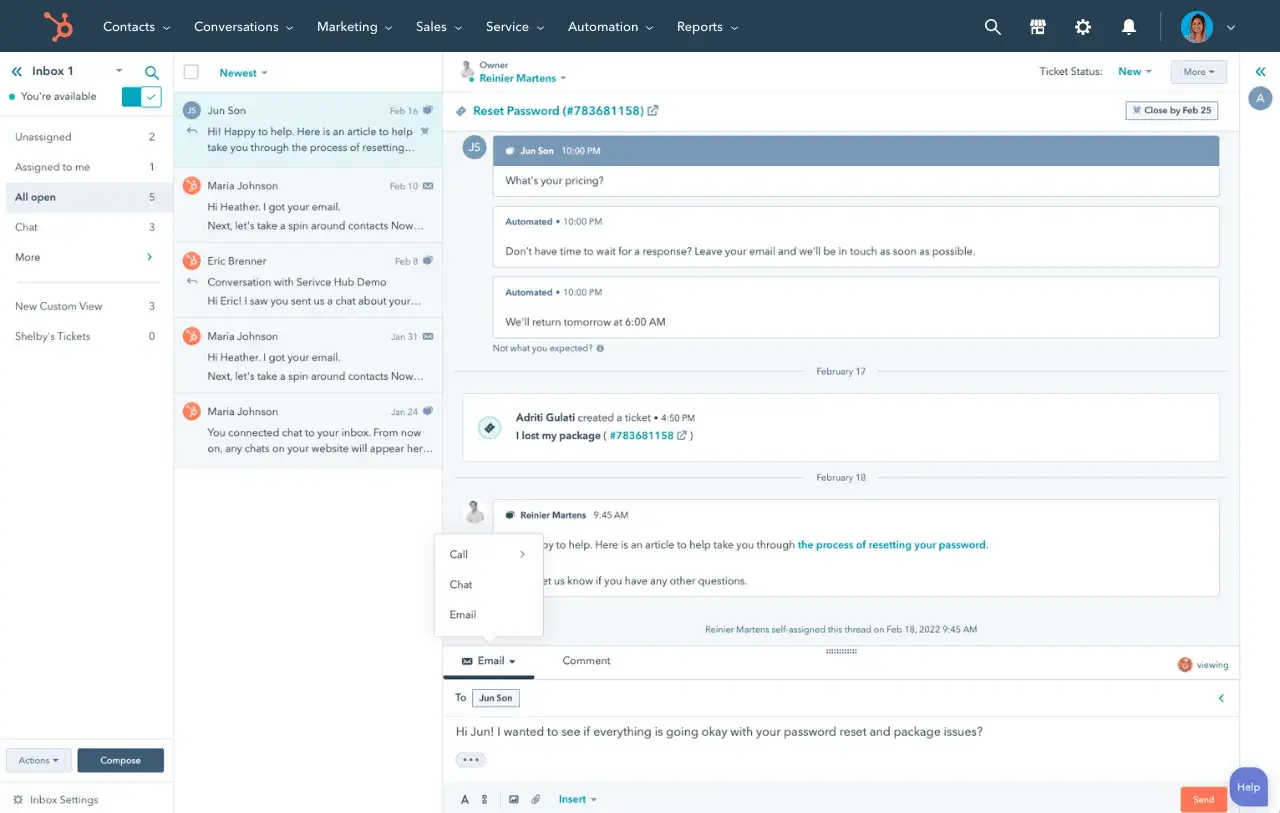
The conversations inbox gathers messages from connected channels in one place so teams can view and reply to ongoing conversations. HubSpot creates a default inbox for new accounts, and teams can control access and connect additional channels.
Accounts created after April 1, 2024, cannot create tickets from channels connected to the conversations inbox; those accounts should manage tickets in help desk. Teams can still use the inbox as a shared space and move supported conversations between the inbox and the help desk as needed.
Key Features
- Shared message view: Bring connected channels into one workspace for customer conversations.
- CRM context: Review associated customer information while responding.
- Access and assignment controls: Manage team access and route incoming messages to eligible users when the account has the required seats.
Best for: Teams that need a shared communication inbox and do not require every conversation to start as a support ticket.
Pricing: HubSpot provides a default conversations inbox across its products and plans. Some routing and additional inbox capabilities require a paid seat or subscription.
What we like: The conversations inbox separates general shared communication from formal ticket management while keeping both workflows connected to CRM records.
Free Customer Service Metrics Calculator
Calculate your business's key metrics and KPIs for customer support, service, and success with this free template.
- Customer Acquisition Cost
- Customer Lifetime Value
- Customer Satisfaction Score
- And More!
Download Free
All fields are required.
Form not available
Customer Feedback
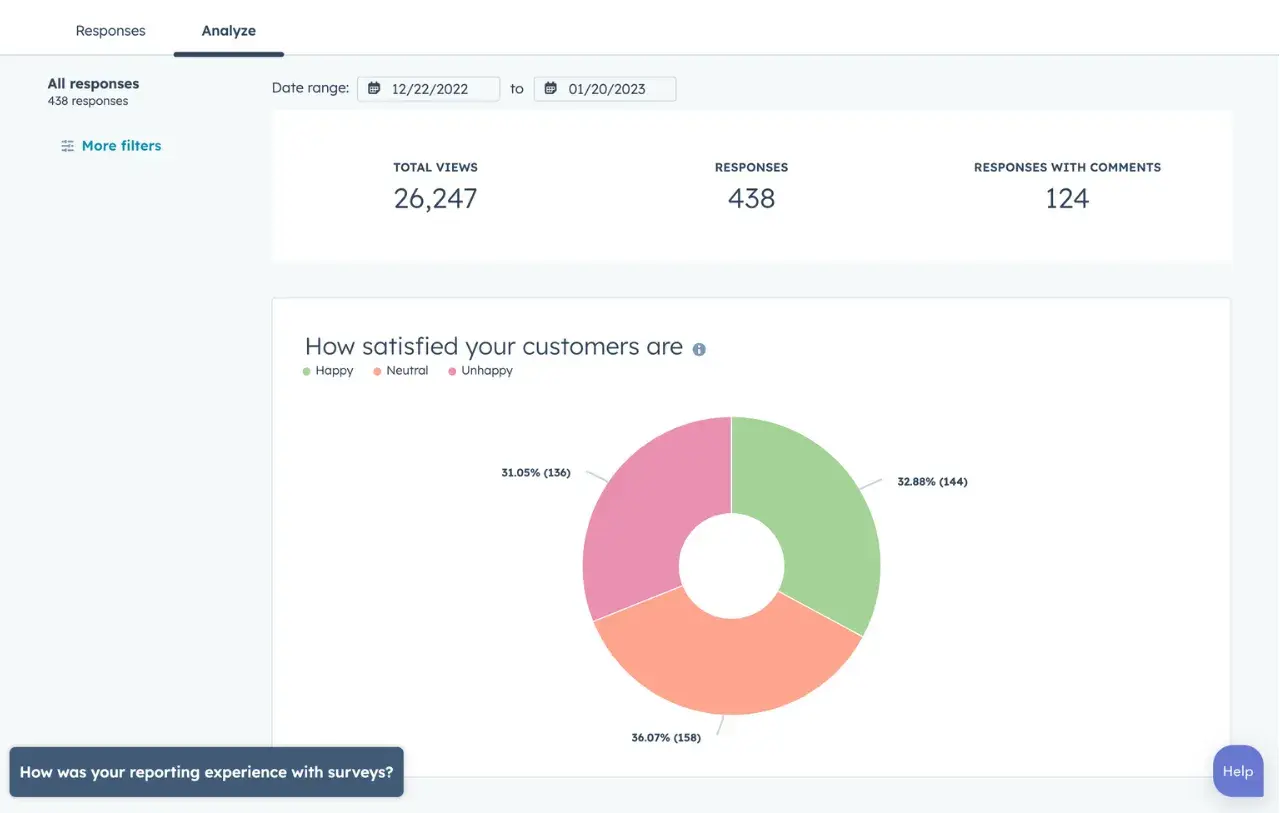
Customer feedback lets teams create NPS, CSAT, and customer effort score surveys, collect responses, and analyze results in feedback dashboards. Because survey responses are linked to CRM records, teams can segment scores by account tier, lifecycle stage, or other relevant properties.
Use one consistent survey type, audience, delivery method, and reporting window throughout an OKR cycle. A change in method can move the score even when the underlying customer experience does not change.
Key Features
- Prebuilt survey types: Create NPS, CSAT, and customer effort score surveys.
- CRM-based segmentation: Connect responses to customer records and analyze defined audience groups.
- Feedback dashboards: Review scores, response volume, and trends in one reporting view.
Best for: Teams that use NPS, CSAT, survey response rate, or segment-level feedback as key results.
Pricing: Full customer-feedback survey functionality requires Service Hub Professional or Enterprise. Professional starts at $90 per seat per month, plus a one-time $1,500 onboarding fee. Enterprise starts at $150 per seat per month, plus a one-time $3,500 onboarding fee.
What we like: CRM-connected responses let teams move beyond a blended score to investigate which customer segments need different follow-up plans.
Customer Success Workspace
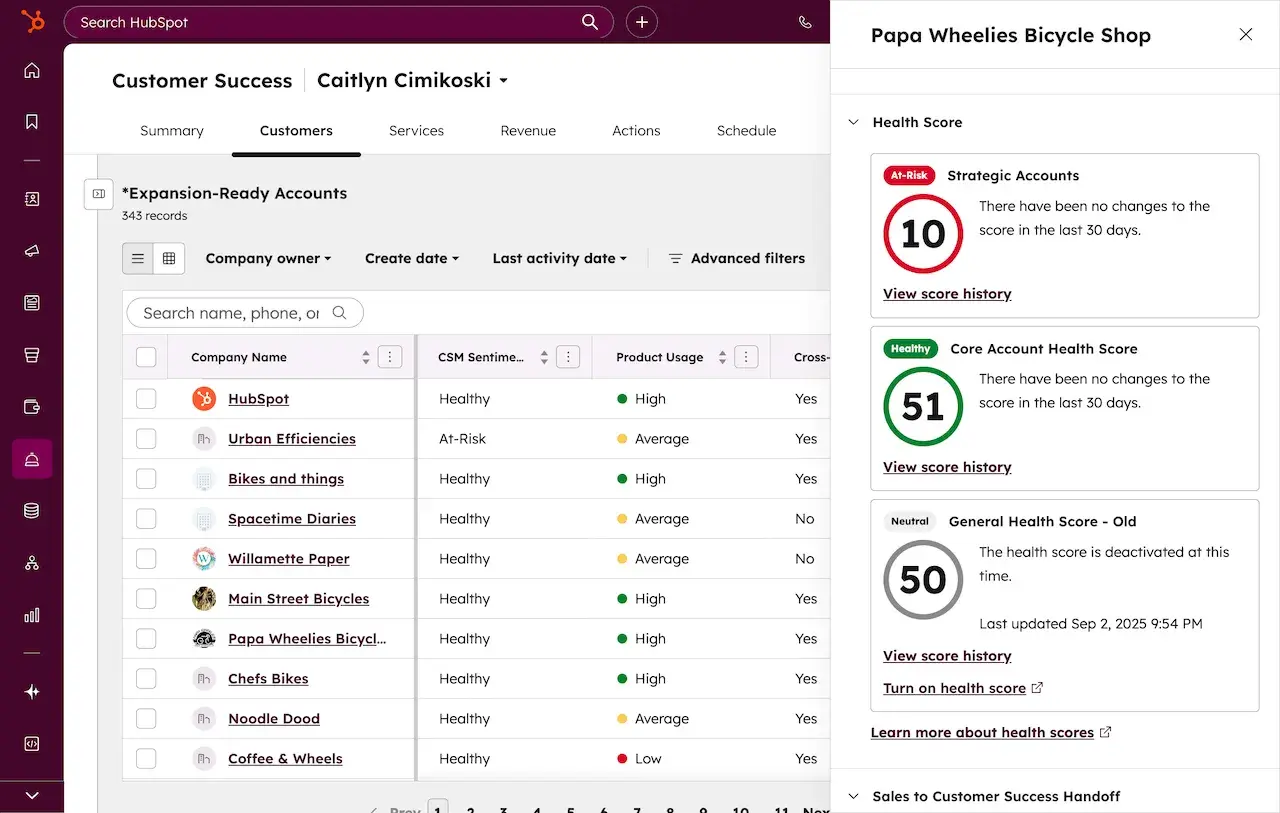
The customer success workspace gives CS teams an account-level view of health, activities, renewals, projects, and revenue. Teams can define the customer records and renewal-date properties that feed the workspace, create tailored views, and use health scores to prioritize outreach.
Add the OKR dashboard to the workspace so CSMs can move between overall progress and the accounts behind it. HubSpot allows teams to add up to five dashboards to a customer success workspace.
Key Features
- Health scoring: Configure scores using signals and thresholds aligned with the company’s customer model.
- Renewal and revenue views: Review upcoming dates, revenue records, and assigned accounts in one workspace.
- Connected dashboards: Add selected dashboards to the workspace for team-level visibility.
Best for: CS teams that track health, renewals, expansion, and account-level interventions.
Pricing: The customer success workspace requires Service Hub Professional or Enterprise, plus a Service Seat, to access workspace management features. Professional starts at $90 per seat per month, plus a one-time $1,500 onboarding fee. Enterprise starts at $150 per seat per month, plus a one-time $3,500 onboarding fee.
What we like: The workspace connects an aggregate key result to the customer records that drove it, helping managers turn a weekly review into prioritized account action.
Customer Agent
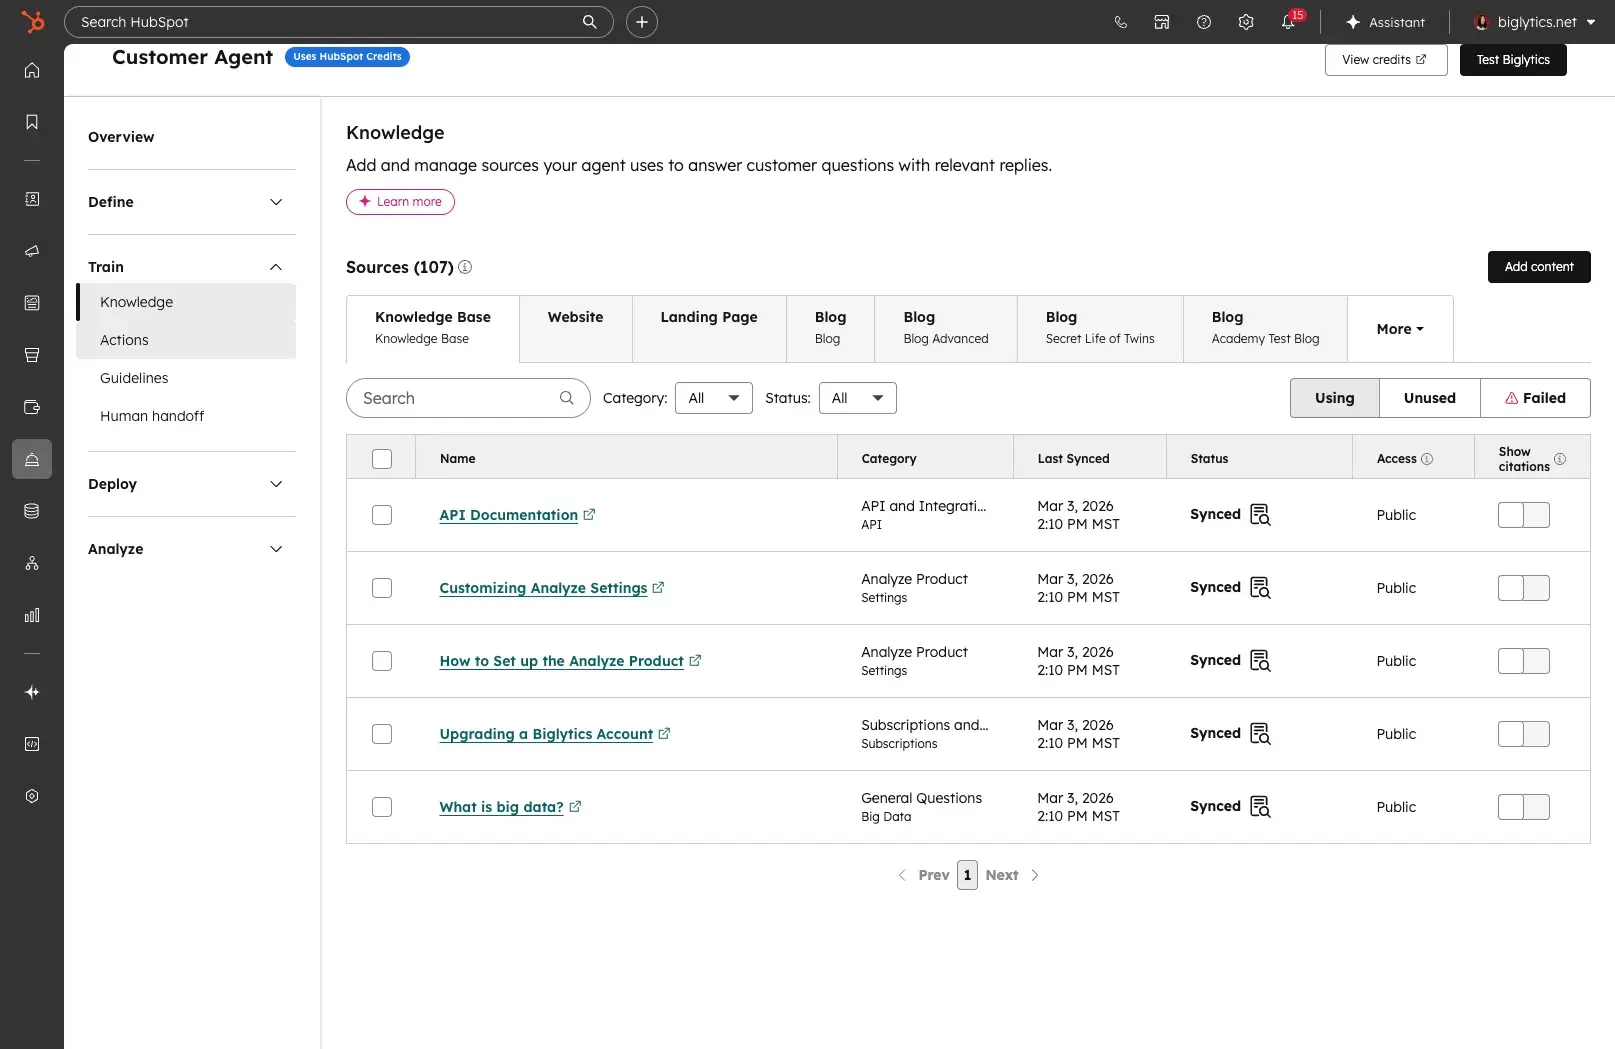
Customer agent answers supported customer questions across connected channels and transfers conversations that need a person. Teams can ground its answers in approved content, define handoff behavior, and review performance.
Use customer agent metrics for automation-focused key results only after the team defines what counts as a resolved conversation. HubSpot counts a support resolution when a customer agent provides support and does not transfer the conversation to a person for 72 hours; it can also count a qualified lead as a resolution.
Key Features
- Grounded answers: Use approved website, knowledge base, and document content to answer customer questions.
- Human handoff: Transfer conversations to a team member when the agent cannot complete the request.
- Performance reporting: Track resolutions and review which content supports successful answers.
Best for: Teams that want to automate repeat questions while preserving a defined handoff path.
Pricing: Customer agent comes with Professional and Enterprise subscriptions and uses HubSpot Credits. HubSpot prices it at $0.50 per resolved conversation; included monthly credits vary by subscription.
What we like: The explicit resolution definition gives teams a measurable automation key result instead of a vague target such as “use more AI.”
Knowledge Base
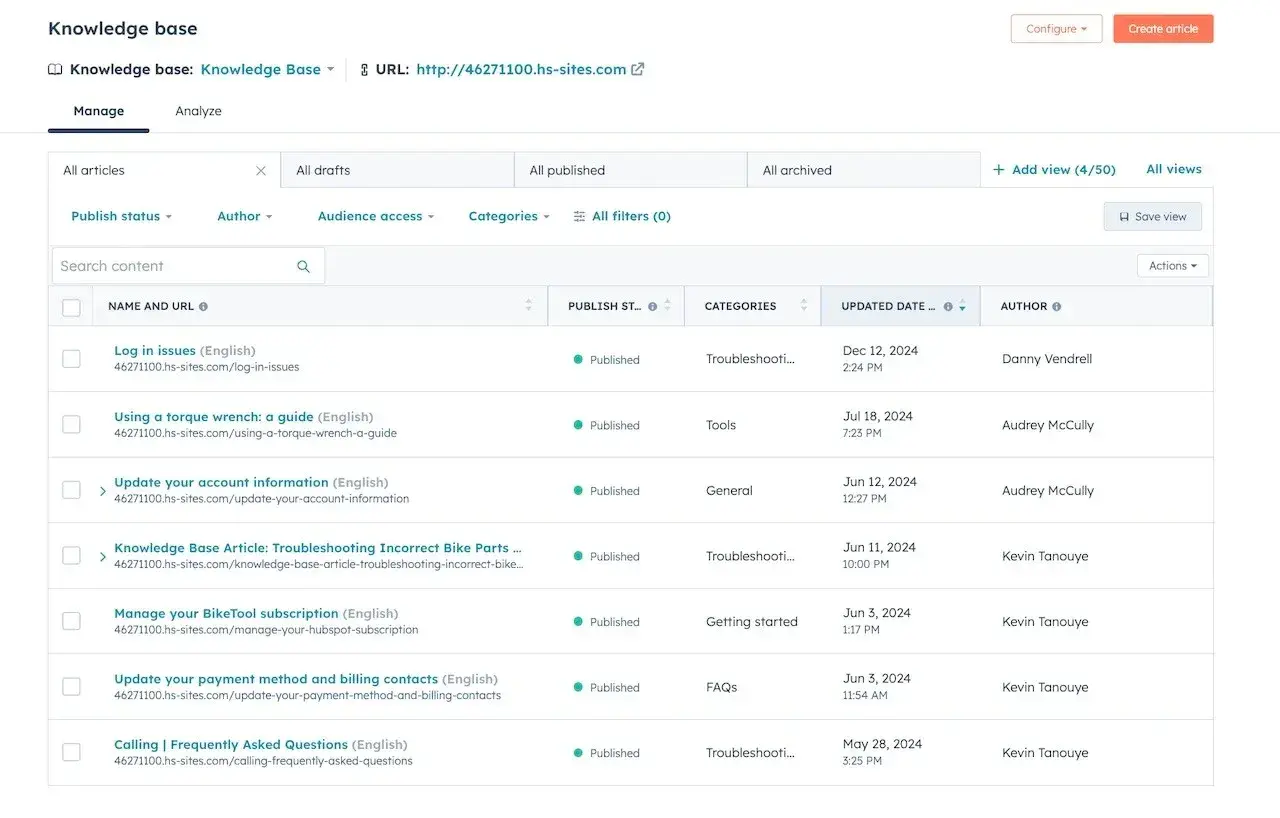
Knowledge base lets service teams publish searchable self-service articles and connect them to support workflows. Teams can organize articles by topic, publish in multiple languages, and use built-in reporting to identify content gaps and performance trends.
Pair knowledge base usage with a customer outcome. For example, track whether customers who view a setup article complete the relevant onboarding milestone or whether a new article reduces repeat tickets about the same issue.
Key Features
- Searchable help content: Publish articles that answer common customer questions.
- Content-gap insights: Use search and support signals to identify topics that need documentation.
- Knowledge-base reporting: Review article views, feedback, and other available performance data.
Best for: Teams that use self-service adoption, repeat-ticket reduction, or onboarding documentation to improve key-result outcomes.
Pricing: Knowledge base requires Service Hub Professional or Enterprise. Professional starts at $90 per seat per month, plus a one-time $1,500 onboarding fee. Enterprise starts at $150 per seat per month, plus a one-time $3,500 onboarding fee.
What we like: Knowledge base connects the operational work of documenting an answer to measurable customer behavior, so a team can test whether self-service improves the intended outcome.
Customer Service Metrics Calculator
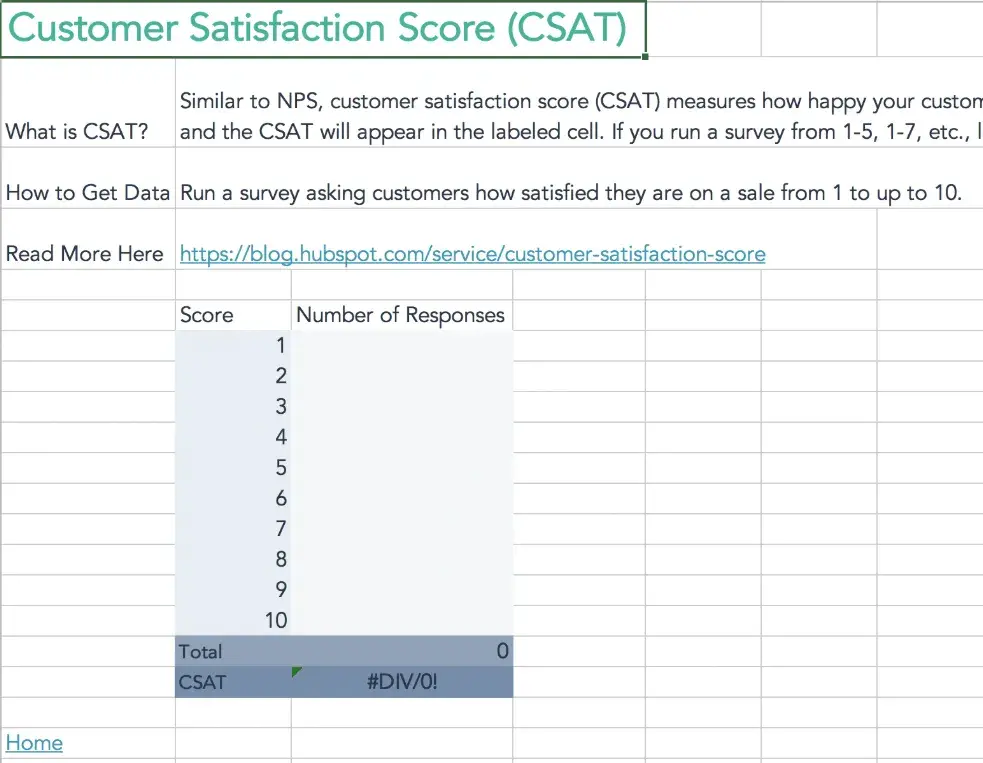
HubSpot’s free Customer Service Metrics Calculator is an Excel template that calculates and tracks 10 customer service measures. They include CSAT, customer acquisition cost (CAC), customer lifetime value (CLV), the CAC-to-CLV ratio, NPS, customer effort score, retention rate, revenue churn, first-contact resolution, and average ticket time.
Use the calculator to establish an initial baseline when the team has raw data but no consistent formula. Then document the same formula and data source in the key-result definition before the quarter begins.
Key Features
- Defined formulas: Calculate 10 customer service metrics in one workbook.
- Baseline support: Convert raw data into a baseline before setting an OKR target.
- Reusable tracking: Apply the same calculation across later reporting periods for consistent comparisons.
Best for: Teams that need a free starting point before they build automated reporting.
Pricing: Free.
What we like: The calculator removes formula ambiguity at the baseline stage, helping teams avoid changing the measurement method once the OKR cycle starts.
Build the Customer Success OKR Dashboard
Create one report for each key result, then save the reports to a dashboard named for the OKR cycle. Keep the report filters aligned with the key result’s segment, formula, and date range. For supported service and custom goals, add the goal-performance report so the dashboard shows actual progress against the target.
Use the weekly review to examine the dashboard, record status, and assign follow-up work. When a metric changes, move from the dashboard to the relevant tickets, feedback responses, or customer records to identify the cause. At midquarter, change a target only when the original assumption no longer applies, and document the reason for the reset.
How to Align Customer Success OKRs with Sales and Product
Align the key results of customer success, sales, and product to the same customer outcome. Sales shapes expectations and handoff quality, product addresses adoption barriers, and CS monitors value realization and retention. Shared outcomes give leaders one view of where customers lose momentum. HubSpot’s comparison of customer success and sales explains how the teams’ responsibilities differ.
Aligning CS OKRs with Sales
The sales-to-CS handoff creates the primary alignment point. When sales closes a deal, it should transfer the customer’s expectations, use case, stakeholders, and success criteria to CS. An incomplete handoff can lengthen onboarding, delay activation, and increase the risk of early churn.
Pair sales and CS key results around one outcome. For example, sales can own the percentage of closed customers that match the agreed ideal-customer profile, while CS owns 30-day activation for the same cohort. Both measures help the company understand whether it sold to the right customers and helped them reach value.
Pro tip: Review early-churn patterns by deal source and compare them with the commitments sales documented at close. That analysis gives sales and CS a specific place to correct expectation or handoff problems.
Aligning CS OKRs with Product
CS teams hear directly from customers who struggle to realize value, which provides them with useful product feedback. The signal only helps when teams send it to product in a structured, prioritized form.
Define the trigger, action, and outcome for the feedback loop. A trigger might be a cluster of tickets, a recurring failure of an onboarding milestone, or a theme in NPS detractor responses. CS should then send product a structured summary with the affected segment, frequency, revenue or retention impact, and supporting examples. Product can use that context to evaluate the roadmap’s priority.
My take: At Skybound, I built a closed-loop voice-of-customer system that turned support signals into product and marketing priorities for leadership. The system worked because it paired qualitative frustration with quantified business impact before the feedback reached the product team. A complaint without a number is a suggestion; a complaint tied to churn is a priority. That framing helped customer experience earn a place in roadmap discussions.
Using Cross-Functional OKRs
A cross-functional OKR gives CS, sales, and product a single objective, with each team owning a separate key result.
Objective: Help more new customers remain active through their first 90 days.
- Sales key result: Increase the percentage of new customers that meet the agreed ideal-customer profile from 78% to 90% by the end of Q4.
- CS key result: Increase 30-day activation for new customers from 54% to 70% by the end of Q4.
- Product key result: Reduce the percentage of new customers blocked by the top three onboarding issues from 26% to 10% by the end of Q4.
Each team owns one measure, but all three measures support the same customer outcome. Review the cross-functional OKR in a monthly leadership meeting to identify dependencies, assign escalations, and adjust resources when a key result falls behind.
Best for: Growth-stage companies that need a formal process for coordinating sales, CS, and product around retention.
Free Customer Service Metrics Calculator
Calculate your business's key metrics and KPIs for customer support, service, and success with this free template.
- Customer Acquisition Cost
- Customer Lifetime Value
- Customer Satisfaction Score
- And More!
Download Free
All fields are required.
Form not available
Structuring the Alignment Calendar
A consistent meeting schedule keeps cross-functional work visible. Use this cadence as a starting point and adjust it to the organization’s decision cycle.
Frequently Asked Questions About Customer Success OKRs
How many customer success OKRs should a team set per quarter?
Set one to three team-level objectives per quarter, with two to four key results for each objective. Choose fewer when one objective requires several teams or a major behavior change.
More than three objectives can spread attention too thin. Put routine work in KPI reporting or project plans instead of turning every priority into an OKR.
What key results are most common for customer success OKRs?
Common retention key results include churn rate, renewal rate, and customer health score. Satisfaction key results often use NPS, CSAT, first response time, and resolution time. Onboarding key results often use TTFV, onboarding completion rate, and milestone attainment. Expansion key results often use expansion MRR, NRR, and multi-product adoption.
Every strong key result names a baseline, target, deadline, owner, and reporting cadence.
How do I set baselines if my data is incomplete?
Define the audience, measurement method, and reporting window, then use the first complete measurement cycle as the baseline. Apply the same method in the next cycle to keep the comparison valid.
Do not wait for perfect historical data. Document the baseline’s limits and refine the method as the team collects more consistent data.
Should individuals have OKRs or just the CS team?
Use team-level OKRs as the primary framework. Give an individual an OKR when that person controls a distinct set of accounts or a functional outcome and can make the decisions required to advance it.
Do not cascade every team key result to every contributor. Assign one accountable owner to each key result and let the rest of the team contribute through projects and routine responsibilities.
How often should we review and reset OKRs?
Review customer success OKRs weekly at the team level. At midquarter, reassess a target when a product launch, market shift, organizational change, or invalid baseline assumption changes the conditions behind it.
Document any reset, explain why the original assumption no longer applies, and preserve the original value for context. A quarterly cycle usually fits customer success better than an annual cycle because the underlying metrics can change quickly.
Start with one.
Customer success OKRs turn retention data into focused quarterly action. Strong programs connect objectives to business priorities, build key results from real baselines, assign one owner to each key result, and review progress weekly. HubSpot’s guide to customer success in SaaS explains the broader operating model that supports this work.
Service Hub brings goals, service analytics, help desk, the conversations inbox, and customer data together in HubSpot. CS managers can save goal and metric reports to an OKR dashboard, then use the customer success workspace to investigate why a result changed at the account level. Teams that still need baselines can use HubSpot’s free Customer Service Metrics Calculator to calculate and track 10 customer service metrics before setting the first OKR.
After years of building CS and support infrastructure across several industries, I have found that retention problems rarely come from a complete lack of data. Teams more often lack a framework for choosing which numbers deserve attention, assigning ownership, and defining success for the quarter. Start with one objective, establish the baseline, and run the first cycle. Use what the team learns to sharpen the next one.
Free Customer Service Metrics Calculator
Calculate your business's key metrics and KPIs for customer support, service, and success with this free template.
- Customer Acquisition Cost
- Customer Lifetime Value
- Customer Satisfaction Score
- And More!
Download Free
All fields are required.
Form not available