Sales metrics are guideposts that signal to sales managers when it’s time to act and make changes, or when it’s time to keep following existing strategies. By choosing the right metrics to follow, you can understand your strengths and weaknesses and lead your team to better performance.
This ultimate guide to sales metrics will help you identify the top sales metrics to follow and what each can tell you.
Table of Contents
- Key SaaS Sales KPIs to Track
- Sales metrics dashboard
- What are sales metrics?
- Key Sales Metrics to Track
- Leading and Lagging Indicators in Sales
- SaaS Sales Metrics
- Sales KPIs by Team Type
- Sales KPI Template
.png)
Free Sales Metrics Calculator
A free, interactive template to calculate your sales KPIs.
- Average Deal Size
- Customer Acquisition Cost (CAC)
- Customer Lifetime Value (CLV)
- And more!
Download Free
All fields are required.
Form not available
What are sales metrics?
Sales metrics are data points that represent sales performance on individual, team, or company levels. They help teams track progress toward goals, prepare for future growth, adjust sales compensation and incentives, identify challenges, and optimize the sales process.
While this may seem like a dizzying amount of numbers, each of these sales metrics starts with an individual. These metrics range from a macro level (company-wide performance), to a team level, then to an individual level.
My best sales manager, Mike, was a great mentor and coach. He helped me understand many of these sales metrics and coached us to close several large deals. By starting small and coaching reps to know and improve their numbers, you can lift the entire organization.
Key Sales Metrics to Track
1. Total Revenue
Measures: Sales performance and effectiveness
Who this sales metric is helpful for: Sales managers+
Total revenue, also known as gross sales or turnover, is a crucial metric in evaluating your business's financial health and success. It is the entire income generated from all operational and sales activities across all products and services.
Calculate total revenue using:
Total revenue = Quantity of products and services sold x Price of the product or service
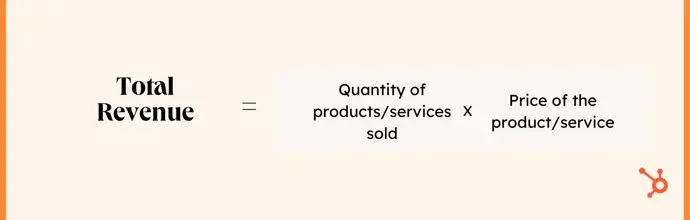
Suppose your company sells 100 units of its product for $10 per unit. Your total revenue would be $1000.
What I look for: Your business's total revenue objectively measures your ability to generate income. It helps monitor your progress and make informed decisions about enhancing profitability and optimizing sales operations.
Michele Potts, Director of Sales at Zoe Marketing and Communications, told me, "Tracking sales revenue helps you understand the direct outcome of your sales efforts. It allows you to gauge the effectiveness of your strategies and make informed decisions to drive growth.”
2. Percentage of Revenue From New Business
Measures: Sales performance and effectiveness
Who this sales metric is helpful for: Sales managers+
The percentage of revenue from new business is the monthly or quarterly revenue generated by new customers.
Calculate the percentage of revenue from a new business using this formula.
Percentage of revenue from new business = (Revenue from new customers / Total revenue) X 100
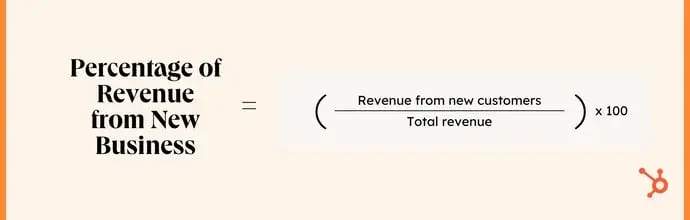
If your company generates $20,000 in revenue from new business and has total revenue of $100,000, it generates 20% of its revenue from new business.
What I look for: New business transactions, such as new SaaS subscriptions or added mobile device loads, are a strong indicator of future increased recurring revenue. It indicates your company’s growth and success in acquiring new customers, and your ability to generate income from these new relationships. Celebrate these wins, but watch other metrics in parallel, such as customer retention and revenue churn rates.
3. Percentage of Revenue From Existing Customers
Measures: Sales performance and effectiveness
Who this sales metric is helpful for: Sales managers+
The percentage of revenue from existing customers is the income you generate from cross-selling and upselling, repeat orders, and expanded contracts.
Calculate the percentage of revenue from existing customers with this formula.
Percentage of revenue from existing customers = (Revenue from existing customers / Total revenue) * 100
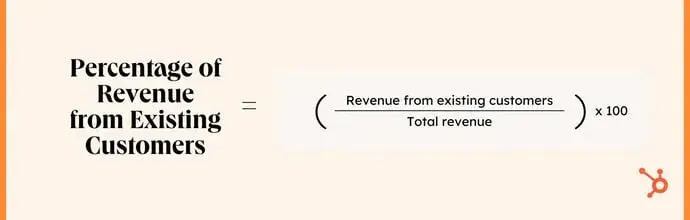
If your company has total revenue of $100,000 and generated $20,000 in revenue from new business, it generated 80% of its total revenue from existing customers.
What I look for: In my software sales days, my company followed the land and expand business model. We would secure a contract for an initial requirement, then gradually increase the value of the account with additional products and services. Tracking revenue from existing customers helps you understand the success of your customer retention and expansion efforts, which is important because it’s more cost-effective than acquiring new customers.
All this is to say that it’s important to have a good balance of revenue from new and existing customers. Don’t take either metric as the full story of your company’s sales performance.
4. Conversion Rate
Measures: Sales performance and effectiveness
Who this sales metric is helpful for: Individual reps for personal performance (BDR, SDR, etc.), and sales managers+
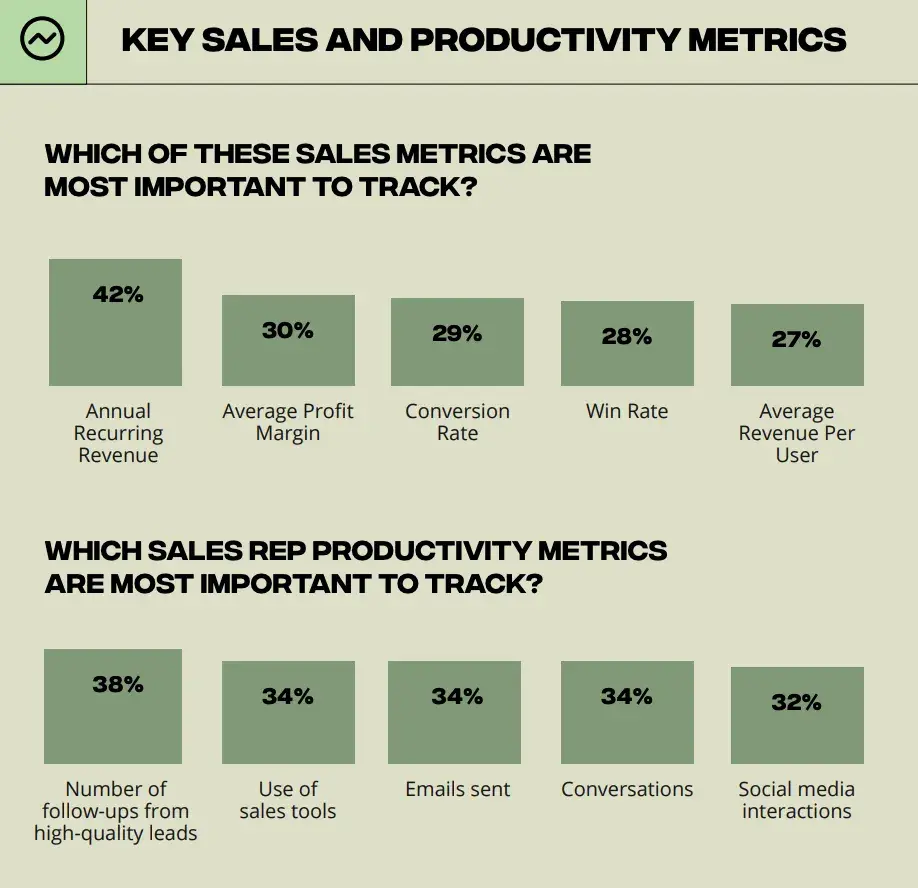
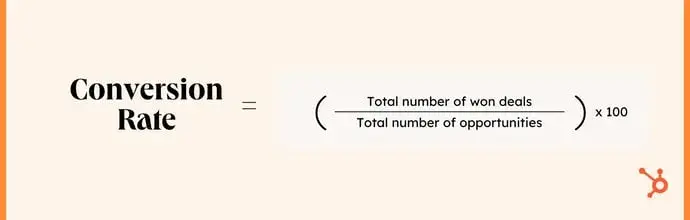
What it is: Conversion rate is the percentage of leads that turn into customers. Sales teams rank this as the third most important sales metric that they track.
Your conversion rates define your level of success. Higher numbers mean you’re well able to convert customers and can continue with your current process. If your conversion rates are lower, you have the opportunity to optimize your sales cycle to better target and speak to your leads.
Calculate conversion rate using this formula.
Conversion rate = (Total number of won deals / total number of opportunities) x 100
How I increase it: It can be difficult to move the needle on conversion rates. If conversions are low, recycling the same pitch over and over won’t work. As a sales rep, I learned to personalize my sales pitch based on the information I had about my prospect. This could be information the rep gleaned from conversations or rich intelligence from your CRM data.
5. Cost of Selling
Measures: Sales performance and effectiveness
Who this sales metric is helpful for: Sales managers+
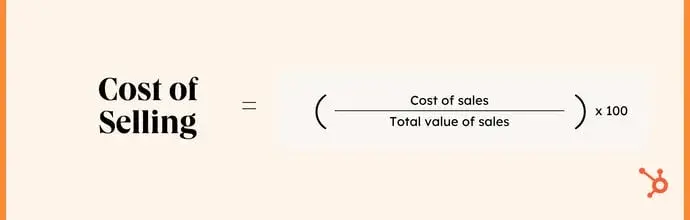
The cost of selling, also referred to as selling expenses or sales expense ratio, is the overall comparison of a sales activity's expenses to the revenue it generates. It’s helpful to measure it as a percentage.
Calculate sales expense ratio with this formula:
(Cost of sales) / (Total value of sales) x 100
What I look for: Understanding how much you spend throughout your selling process lets you know if you’re spending money in valuable ways. If you have a lower ratio, you’re effectively generating revenue. If you spend more money selling than you get as profit, you’re overspending to bring in customers and can benefit from revisiting your sales strategies and optimizing your process so nothing goes to waste.
6. Average Length of Sales Cycle
Measures: Sales performance and effectiveness
Who this sales metric is helpful for: Individual reps assessing personal performance, sales managers+ for team performance
The average sales cycle length refers to the time it takes for potential customers (leads) to go through the various stages of the sales process until they become a successfully closed deal.
Calculate the average length of sales cycle with this formula:
(Total number of days to close all deals) / (Total number of deals) = Average Sales Cycle
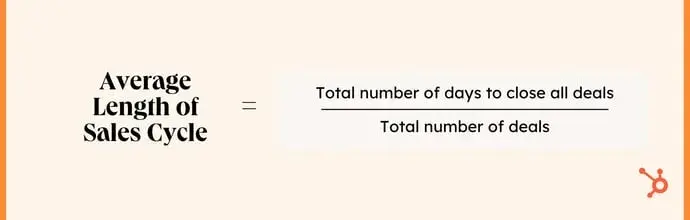
What I look for: Knowing how long it takes to convert a lead into a customer helps with forecasting, resource allocation, and planning. Chris Percival, Founder & Managing Director at CJPI, tells me, “Tracking the sales cycle more closely helped us to identify bottlenecks that extended our cycle and helped us refine our approach. We continue to streamline steps that are not improving the customer experience and are dragging deals out. We now close more deals faster, boosting our revenue and allowing for better forecasting.”
7. Market Penetration
Measures: Sales performance and effectiveness
Who this sales metric is helpful for: Sales managers+
Market penetration is your total customer base compared with the total market potential.
Calculate the market penetration rate using the following:
Market Penetration Rate= (Number of customers/Total Target Market Size) X 100
If your company sells its product to 500 customers with a target market of 1000 customers, your market penetration rate is 50%.
The higher the market penetration rate, the greater the opportunity for growth and revenue.
What I look for: Your market penetration rate will give you valuable insight into your market potential and help you develop strategies to increase your market share.
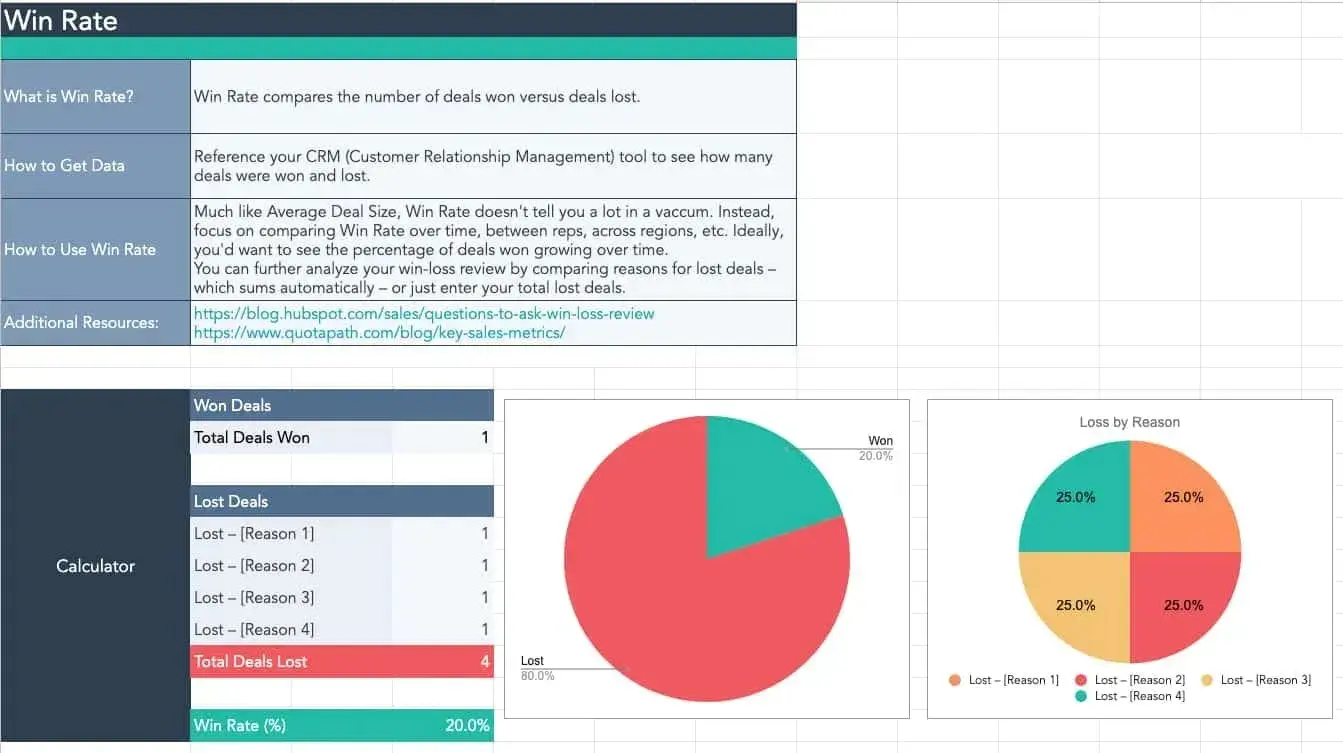
8. Win Rate
Measures: Sales performance and effectiveness,
Who this sales metric is helpful for: Any individual sales rep (BDR, SDR, etc.), and sales managers+ for team performance
Win rate refers to the proportion of successful deals out of the total number of opportunities. It can be evaluated at the team and individual levels, providing valuable insights into performance and effectiveness.
Calculate the win rate using this formula.
Win rate = (Number of won opportunities / Total number of opportunities) X 100
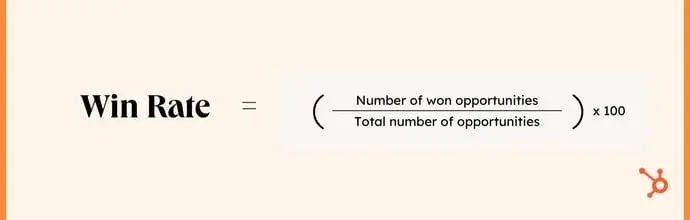
If your sales team had 100 sales opportunities for a particular product and closed 50 of them, the win rate is 50%.
What I look for: Win rate is a true bellwether sales metric — it’s highly indicative of future growth. It helps sales managers to identify pipeline bottlenecks, improve forecast accuracy, and benchmark team and individual performance. If your company can sustain a healthy win rate long-term, it bodes well for YoY growth. Once you understand your team’s win rate, the next step is improving it through better sales processes, training, and resourcing. Sales Focus Inc. outlines five strategies to increase sales performance, from tightening your sales metrics to leveraging outsourced sales teams.
9. Year-Over-Year Growth
Measures: Sales performance and effectiveness
Who this sales metric is helpful for: Account managers, sales managers+
Year-over-year (YoY) growth is the metric that compares revenue generated from year to year.
Calculate YoY Growth using:
YoY Growth = ((Current Year Revenue - Previous Year Revenue) / Previous Year Revenue) * 100
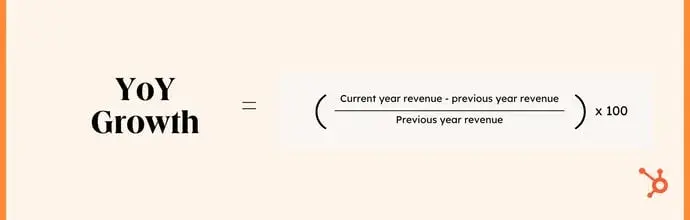
For example, if your company had revenue of $100,000 in 2021 and $120,000 in 2022, it had 20% YoY growth in revenue from 2021 to 2022.
You can also use this formula for any specific sales period. For example, if you wanted to see quarterly growth, you would simply do (current quarter metric - previous quarter metric)/ previous quarter metric * 100
What I look for: YoY growth is a valuable way to evaluate overall performance and success in growing your business and meeting your goals. It’s also a metric you can use as a selling point. When I worked for a Microsoft partner, I remember how exciting it was to represent a solution with a 40% growth rate and strong positive feedback from clients and partners.
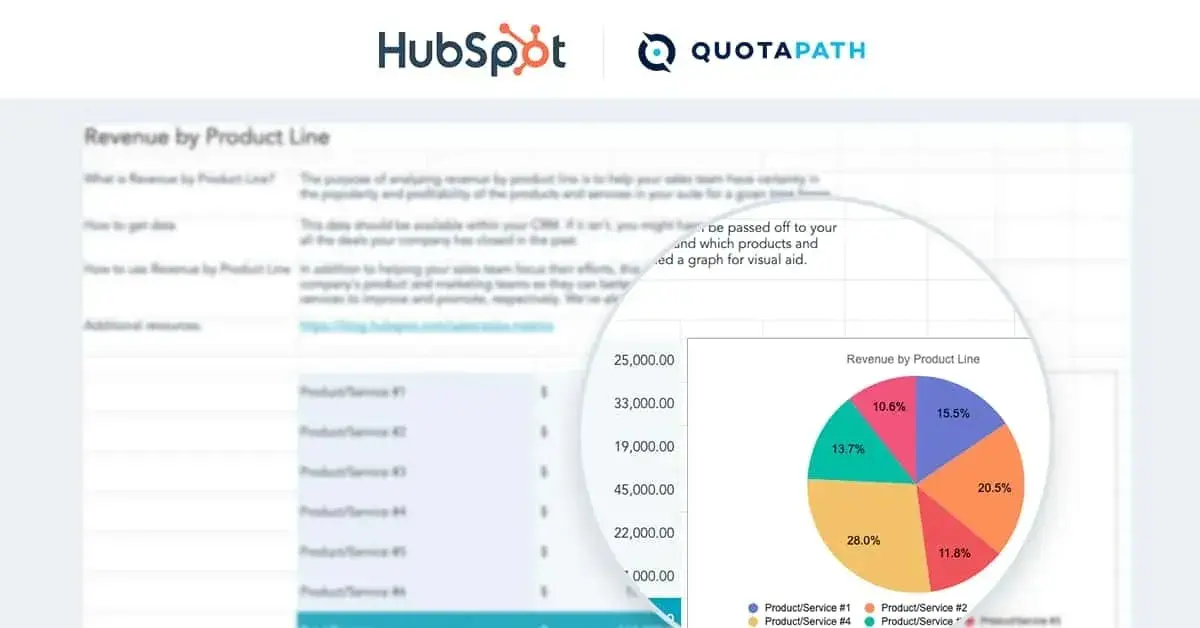
10. Revenue by Product or Service
Measures: Sales performance and effectiveness
Who this sales metric is helpful for: Individual reps, sales managers+
Revenue by product or service is the income generated by a product or service. It’s vital for understanding the financial performance of different products and services. The best way to track this is within your CRM since it’s typically automatically tracked.
What I look for: Tracking revenue by product or service lets you identify your most and least profitable offerings and optimize your product mix to drive growth.
Free Sales Metrics Calculator
A free, interactive template to calculate your sales KPIs.
- Average Deal Size
- Customer Acquisition Cost (CAC)
- Customer Lifetime Value (CLV)
- And more!
Download Free
All fields are required.
Form not available
11. Average Customer Lifetime Value (CLV)
Measures: Sales performance and effectiveness
Who this sales metric is helpful for: Individual reps, sales managers+, finance, product, and marketing teams
The average customer lifetime value is a metric that measures the total revenue your business can anticipate generating from a single customer over the course of its relationship with your company.
CLV considers various factors such as customer behavior, purchase frequency, and average order value, providing valuable insights into each customer's value to the business. Zeeshan Khan, CEO of Dark Square, says that CLTV is the most important sales metric he tracks for his marketing and advertising agency. He says the metric has also helped him identify high-value customer segments and optimize marketing budgets by focusing on channels delivering the highest CLV.
To calculate CLTV, use the following formula.
Customer Lifetime Value = Customer Value x Average Customer Lifespan
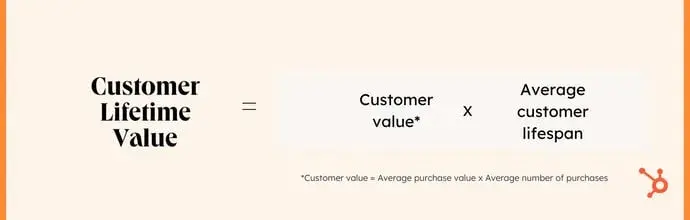
What I look for: The faster the customer realizes measurable value, the more likely they are to stick around — and buy more. I once closed a government deal at a steep discount due to public-sector pricing. My VP wasn’t upset — he knew the referrals and following training and consulting revenue would more than make up for it. This keeps your focus on time-to-value, not just deal size.
12. Net Promoter Score (NPS)
Measures: Customer satisfaction
Who this sales metric is helpful for: Sales managers+, marketing teams, account managers
Net Promoter Score is a customer satisfaction and loyalty metric that measures how likely customers are to recommend your business to others.
To calculate NPS, you survey your customers and ask, “On a scale of 0 to 10, how likely are you to recommend us to a friend?”
You then categorize respondents as detractors (0-6), passives (7-8), and promoters (9-10). Next, you subtract the percentage of detractors from the percentage of promoters.
Results range from 0 to 100, and higher scores mean customers are more satisfied and likely to recommend you to others.
How I improve it: NPS scores are highly influenced by customer experiences from initial onboarding to ongoing support, and beyond. To understand the ‘why’ behind different experiences and improve them, follow up with tailored responses for different categories, and analyze reviews on sites like TrustPilot and G2.
13. Number of Deals Lost to Competition
Measures: Sales performance and effectiveness
Who this sales metric is helpful for: Sales managers+, business development reps, sales development reps
Number of deals lost to competition is the number of opportunities you failed to win due to competition from direct competitors.
What I look for: Quantifying deals lost to competitors over time to monitor trends is a good start for competitive intelligence about what market players are the biggest threats to immediate and long-term revenue. Add context with a competitive analysis template to show which strengths of the competitive solution (or weaknesses of yours) influenced the customer to buy from the other guys. I’m always a fan of debrief calls, whether I won or lost a deal.
14. Weighted Value of Pipeline
Measures: Sales performance and effectiveness
Who this sales metric is helpful for: Sales managers, BDRs, SDRs
The weighted value of the pipeline metric shows the estimated value of deals as they move through the sales pipeline. You assign a value to each potential deal based on its position in the sales funnel and the likelihood of it closing.
Calculate the weighted value of the pipeline rate using the following:
Weighted value of pipeline = Probability of the deal closing x Deal value
Here, the probability depends on the stage of the pipeline. For example, the probability in the negotiation stage can be considered as 50%. If you’re a HubSpot user, you can dive into your sales pipeline in the reporting feature.
What I look for: This sales metric helps take some of the guesswork out of forecasting and helps sales managers prioritize deals and allocate resources properly based on how likely they are to close. The companies I worked for standardized the percentage of likelihood of a deal closing based on defined events, like if a customer joined me for a personalized demo, I sent them a proposal, or a contract was in negotiations. Without these event-driven weightings, forecasting would feel like a shot in the dark.
15. Annual Contract Value (ACV)
Measures: Sales performance and effectiveness
Who this sales metric is helpful for: Sales managers+, SDRs, BDRs, account managers
Annual contract value refers to the amount of revenue a contract generates per year.
Calculate annual contract value using this formula:
Annual contract value = Total contract value / The number of years in the contract
If your company signs a five-year contract for $50,000, the Annual Contract Value is $10,000.
What I look for: Calculating ACV helps me identify accounts that generate the most revenue, letting me know which accounts require strategic customer retention strategies and support.
16. Frequency/Volume of New Opportunities Added to the Pipeline
Measures: Sales performance and effectiveness
Who this sales metric is helpful for: Sales managers+, BDRs, SDRs
This metric refers to the rate and number of new sales leads or potential customers added to your sales pipeline.
What I look for: Early in my career, I worked as an IBM sales development rep where we measured the volume of new opportunities added to the pipeline. I wasn’t on a commission plan at the time, but we had some fun competitions competing on opportunity revenue and volume. Similar to weighted pipeline value, it’s important to define the criteria (such as BANT qualification) that constitute an opportunity and thoroughly qualify them so you aren’t filling the pipeline with low-quality leads.
17. Average Lead Response Time
Measures: Sales activities
Who this sales metric is helpful for: Individual reps, sales managers+, SDRs, BDRs
Average lead response time is how long it takes salespeople to respond to a new sales lead. The faster the response, the more likely it is to turn that lead into a customer.
You calculate it by dividing the total time (minutes, hours, or days) spent responding to leads by the total number of contacts
What I look for: Tracking average lead response time can lower response times and increase lead conversion. A delayed reply kills momentum, but it’s not just about responding fast— it’s about responding fast with a personalized, relevant response. The best reps combine speed with skill.
18. Percentage of Leads Followed Up With
Measures: Sales activities
Who this sales metric is helpful for: Individual reps, sales managers+
The percentage of leads followed up refers to the ratio of the number of leads actively pursued and contacted by your sales representatives to the total number of leads generated.
What I look for: Percentage of leads followed up with shows you a rep’s consistency, persistence, and respect for the handoff process. I always appreciated how hard the SDR’s job is. If I thought a lead might be low-quality, I tempered my expectations, but never missed a follow-up. Always follow up anyway— you might be the first rep who actually listens. I’ve turned “cold” webinar leads into six-figure deals because I asked, “What problem brought you to that session?”
19. Percentage of Leads Dropped
Measures: Sales activities
Who this sales metric is helpful for: Individual reps, sales managers+, BDRs, SDRs
The percentage of leads dropped refers to the ratio of the number of leads not pursued or contacted by your sales representatives to the total number of leads generated.
What I look for: This metric is crucial for understanding the quality of your leads. If you see a high drop-off rate, your leads are low-quality and you need to change your marketing approach.
20. Percentage of Qualified Leads
Measures: Sales performance and effectiveness
Who this sales metric is helpful for: Individual reps, sales managers+
The percentage of qualified leads refers to the ratio of the number of leads that meet specific criteria and are deemed ready for the sales process to the total number of leads generated.
The higher the percentage of qualified leads, the more likely your sales team is to close deals and achieve their sales targets.
What I look for: This metric gives me insight into the efficiency of a company’s sales and marketing efforts in attracting high-quality leads. Faton Sopa, Co-Founder & CEO of Superlinks, tells me that the most important metric at his company is qualified sales calls— even more than lead volume. “None of these matter if the person who shows up in front of you on your call is unqualified. That is a loss of time, resources, and investment.”
Featured Resource: Sales Metrics Calculator
Download the Template for Free
21. Email Open Rate
Measures: Sales performance and effectiveness
Who this sales metric is helpful for: Individual reps, BDRs, SDRs, sales managers+
Email open rate refers to the percentage of recipients who opened an email campaign out of the total number of emails sent.
Calculate email open rate using:
Email Open Rate = (Number of Unique Email Opens / (Number of Emails Sent - Number of Bounces)) X 100
For example, if you sent 1,000 emails, 200 were opened, and 200 got bounced, your email open rate would be 25%.
What I look for: Getting someone to open your email is the first, crucial step to gain someone’s attention and trust. This metric gives me a clear picture of my email campaigns' performance and helps me to improve future campaigns. The average open rate is 42% and varies by industry. Track yours and optimize your subject lines to keep it relevant and attention-worthy.
22. Email Response Rate
Measures: Sales activities and sales effectiveness
Who this sales metric is helpful for: Individual reps, BDRs, SDRs, sales managers+
Email response rate refers to the percentage of recipients who respond to an email campaign.
Calculate email response rate using:
Email Response Rate = (Number of Responses / Number of Emails Sent) X 100
For example, if you sent out 100 emails and received 10 responses, your email response rate would be 10%.
What I look for: I like to check the response rate to make data-driven decisions about future email campaigns, such as changing the email content, subject line, or sending time to improve response rates. I also recommend personalizing your emails, either manually or with AI tools.
23. Email Engagement Rate
Measures: Sales performance and effectiveness
Who this sales metric is helpful for: Individual reps, BDRs, SDRs, sales managers+
Email engagement rate is a metric that measures the level of interaction between recipients and an email. Unlike response rate, email engagement rate takes into account a range of actions that recipients may take with an email, such as opens, link clicks, video plays, and so on.
Calculate email response rate using:
Email Engagement Rate = (Total Number of Engagements / Number of Emails Sent) X 100
For example, if you sent 100 emails and received a total of 200 engagements (e.g., 100 opens and 100 clicks), your email engagement rate would be 200%.
Why I recommend tracking it: Email engagement rate is a valuable metric for understanding how recipients interact with your emails and how you can improve your email campaigns going forward.
24. Total Revenue From Partner Deals
Measures: Sales performance and effectiveness
Who this sales metric is helpful for: BDRs, SDRs, account managers, sales managers+
Partnerships are a fantastic way to grow your business. Total revenue from partner deals is the amount earned from partnerships or collaborations with other companies.
This revenue is generated from agreements with other companies to offer products, services, or solutions to its customers. The partner company typically earns a commission or a percentage of total sales generated through channel sales.
What I look for: As a sales rep, I collaborated with partners and enjoyed having an alternative sources of leads. Knowing how much revenue comes through direct sales versus partner deals helps you understand the effectiveness of your partnership programs. This metric is important for monitoring channel partners and supporting them in their marketing, business development, and sales efforts.
25. Revenue by Partner
Measures: Sales performance and effectiveness
Who this sales metric is helpful for: BDRs, SDRs, account managers, channel/partner managers, sales managers+
Revenue by partner refers to the amount of money your company earns from each partnership or collaboration. It provides a detailed view of the revenue generated from each partner, allowing you to understand which partnerships are the most profitable and valuable.
What I look for: By calculating revenue by partner, you can decide which partnerships to keep, grow, or discontinue, and which partners should be rewarded with market development funds (MDFs), awards, and opportunities to achieve higher certification levels.
26. Margin by Partner
Measures: Sales performance and effectiveness
Who this sales metric is helpful for: BDRs, SDRs, account managers, sales managers+
Margin by partner refers to your company's profit from each partnership or collaboration.
Why I recommend tracking it: It provides a detailed view of the profit generated from each partner, allowing you to understand which partnerships are the most profitable and have the highest margin.
27. Retention Rate of Partner Customers
Measures: Sales performance and effectiveness, customer satisfaction
Who this sales metric is helpful for: Individual reps, account managers, sales managers+
The retention rate of partner customers refers to the percentage of customers that continue to do business with your company after their initial transaction through a specific partner.
What I look for: Partners aren’t just channels — they’re extensions of your brand. But many focus only on core requirements. To drive expansion, I used tiered margins, MDFs, and sales playbooks to incentivize upsells. The best partners became co-strategists, not order-takers. Measure not just their revenue —but their expansion rate.
28. Average Cross-Sell and Upsell Rate of Partner Customers
Measures: Sales performance and effectiveness
Who this sales metric is helpful for: Individual reps, account managers, SDRs, sales managers+
In my experience, many partners are laser-focused on selling the products that meet the customer’s core requirements. They often don’t go the extra mile to upsell or cross-sell your complementary products and services because it may exceed the customer’s budget, or they may be reluctant to add scope to the project. The average cross-sell and upsell rate of partner customers refers to the average rate at which customers make additional purchases from a company through a specific partner.
How I improve it: I found the best ways to motivate partners to extend deal value is often to offer tiered margins or incentive plans to partners that sell premium subscriptions, high end products, or your customer success programs. Access to sales enablement resources like playbooks, demo environments, MDFs, case studies and customer conferences can also motivate partners to find ways to increase deal value.
29. Average Customer Satisfaction Score of Partner Customers
Measures: Customer satisfaction
Who this sales metric is helpful for: BDRs, account managers, SDRs, sales managers+
The average customer satisfaction score of partner customers refers to the average rating or score customers give regarding their experience with a company through a specific partner.
The average customer satisfaction score of partner customers can be calculated by taking the average score from all customers who have transacted through a specific partner.
What I look for: Like the sales metric above, this metric tells me the quality of the business each partner is bringing in.
30. Percentage of Time Spent on Selling Activities
Measures: Sales activity
Who this sales metric is helpful for: Individual reps (including SDRs, BDRs, account managers), sales managers+
The percentage of time spent on selling activities refers to the amount of time your sales representatives spend engaging in activities that directly contribute to generating revenue, such as making sales calls, conducting product demonstrations, and closing deals.
What I look for: My goal with this metric isn’t to micromanage my reps’ time. This metric gives me the big picture of a sales team's efficiency and productivity and helps me understand how much time is needed for internal meetings, training, coaching, team-building, etc.
31. Percentage of Time Spent on Manual Data Entry
Measures: Sales activity
Who this sales metric is helpful for: Individual reps (including SDRs, BDRs, account managers), sales managers+
The percentage of time spent on manual data entry refers to the time that employees or sales representatives spend manually entering data into a company's systems or databases. This can include inputting customer information, updating sales records, and entering product information.
What I look for: If you find that you’re spending too much time on manual data entry and similar tasks, it might be time to invest in sales tools that automate the process and give you time to focus on selling. AI-powered tools can take notes, enter and enrich CRM data, and free reps up for higher-value selling activities. Automating manual tasks is the most popular way for sales reps to save time with AI.
Free Sales Metrics Calculator
A free, interactive template to calculate your sales KPIs.
- Average Deal Size
- Customer Acquisition Cost (CAC)
- Customer Lifetime Value (CLV)
- And more!
Download Free
All fields are required.
Form not available
32. Percentage of Marketing Collateral Used by Salespeople
Measures: Sales activity
Who this sales metric is helpful for: Individual reps (including SDRs, BDRs, account managers), sales managers+, marketing teams
I’ve seen decks gather dust because they didn’t reflect real objections or because the sales team simply didn’t know they existed. The percentage of marketing collateral used by salespeople measures how your sales representatives use various marketing materials, such as brochures, flyers, product sheets, case studies, and other promotional items.
How I improve it: I recommend creating an easily accessible library of content and a dashboard for marketing and sales enablement teams to track which collateral is used most and least often. Tracking your usage helps to prioritize which collateral needs to be updated, expanded upon, or taken out of circulation. This data can be used as an icebreaker for conversations between sales and marketing on the topics and kinds of collateral that resonate with customers the most.
33. Average Number of Sales Tools Used Daily
Measures: Sales activity
Who this sales metric is helpful for: Sales managers+
Average sales tool usage refers to how many resources your salespeople use to support their sales activities daily, such as pipeline tracking software, CRMs, or presentation tools.
What I look for: This metric gives me a glimpse into the technology adoption and usage among a company’s sales teams. If adoption of a particular tool is low, I can invest in training and use examples. It can also tell me if a company has too many tools, and if it could benefit from tool consolidation.
34. Percentage of Sales Management Time Spent Recruiting
Measures: Sales activity and sales effectiveness (if compared to number of hires)
Who this sales metric is helpful for: Sales managers+
The percentage of sales management time spent recruiting refers to the amount of time your sales manager dedicates to finding, interviewing, and hiring new salespeople for their team.
This can include reviewing resumes, conducting interviews, participating in job fairs and networking events, and overseeing the onboarding process for new hires.
What to look for: A high percentage of time recruiting is a warning sign that employee churn is too high, or that a sales manager's recruitment efforts may not be as efficient or productive as they could be.
35. Average Time-to-Hire
Measures: Sales activity and sales effectiveness (if compared to number of hires)
Who this sales metric is helpful for: Sales managers+
Average time-to-hire refers to the average time it takes to fill an open position, from when a job is posted to when a candidate is hired. It is a key metric that measures the efficiency and effectiveness of a company's recruitment process.
What to look for: Effective tracking of the average time-to-hire is critical in sales, where time-sensitive positions require prompt filling. Any delays can obstruct the sales team's success in reaching their targets and achieving their quotas. A delay in the hiring process can result in losing top talent, as 55% of job seekers expect job offers to happen within two weeks of the initial interview.
36. Percentage of Hires From Various Sources
Measures: Sales activity
Who this sales metric is helpful for: Sales managers+
The percentage of hires from various sources is a metric that measures the proportion of new hires that come from different recruitment channels.
What to look for: By tracking this metric, organizations can determine which channels deliver the best results in attracting high-quality candidates and allocate resources accordingly to optimize recruitment.
37. Average Turnover Rate
Measures: Sales activity
Who this sales metric is helpful for: Sales managers+
The Average Turnover Rate is a metric that measures the rate at which employees leave your organization. This sales metric measures how frequently salespeople leave a company in a given timeframe. A 2024 Mercer survey found that the average sales personnel turnover rate was 8.4%, compared to 5.4% for top executives and 7.6% for managers. Using these statistics as a benchmark can help sales leaders determine if there are issues related to engagement, culture, compensation plans, or quota achievability that need to be addressed.
Why you should track it: High sales organization turnover doesn’t just impact revenue. It takes a toll on customer relationships, increases hiring and training overhead, and may lead to customer churn and drive business to your competitors.
38. Average Cost to Replace a Salesperson by Role
Measures: Sales activity
Who this sales metric is helpful for: Sales managers+
Replacing a rep costs far more than salary — it’s lost deals, ramp time, and added team fatigue and burnout. The average cost to replace a salesperson by role measures how much it costs to replace a salesperson after they leave. This includes the cost of recruitment, advertising, hiring, training, and lost productivity associated with replacing an employee.
What to look for: By tracking the average cost to replace a salesperson by role, I can identify the financial impact of high turnover and make decisions about employee retention accordingly.
39. Sales Ramp
Measures: Sales activity
Who this sales metric is helpful for: Sales managers+
Sales ramp-up time represents the average time a new salesperson takes to become fully productive. You can use it to make hiring and firing decisions, set expectations with new reps, and develop more accurate sales forecasts.
There are multiple ways to calculate sales ramp time. CRMs often automatically calculate the mean time to 100% quota attainment, which you can use to set the ramp. For instance, if it typically takes a salesperson six months to hit 100% quota, your ramp-up time would be six months.
For a more nuanced approach, factor in training, your sales cycle length, and the sales rep’s level of experience.
Ramp-up = amount of time spent in training + average sales cycle length + X
X is based on the salesperson’s experience: The more they have, the smaller this number is.
Here’s an example for a well-seasoned rep, assuming training lasts 20 days and your average sales cycle is six weeks.
Ramp = 20 days + 42 days + 16 days
This salesperson would need 78 days to reach full productivity.
What to look for: Monitoring sales ramp doesn’t just measure how the new hire acclimates to your sales team, it also reflects on your team’s ability to train, motivate, and scale up your team. Along the way, there are important milestones such as first sales meeting, first closed deal, and first year revenue attainment.
40. Percentage of Reps Following the Sales Process
Measures: Sales activity and sales effectiveness (if compared to other success metrics)
Who this sales metric is helpful for: Sales managers+
The percentage of reps following the sales process refers to the proportion of your sales representatives who consistently adhere to the established steps or stages of the sales process. It is a metric used to track the effectiveness and efficiency of your sales team and the sales process itself.
What I look for: Tracking the percentage of reps following the sales process ensures that all reps follow the same method, resulting in a more consistent sales experience for the customer.
41. Average Level of Satisfaction With Sales Training
Measures: Sales activity
Who this sales metric is helpful for: Sales managers+
The average level of satisfaction with sales training refers to the degree to which your sales representatives are satisfied with the training they receive.
What I look for: I use this sales metric to measure sales training programs' effectiveness and identify areas for improvement.
Now, let’s look at how to make sense of your raw data with leading and lagging indicators.
Leading and Lagging Indicators in Sales
Leading and lagging indicators are used in sales to predict and review your results. Leading indicators (calls, demos, qualified opps) tell you what’s coming. Lagging indicators (revenue, win rate, CLV) tell you what happened. Great sales managers watch both.
Leading Indicators
A leading indicator predicts your results. In other words, it tells you which direction you're trending with enough time to change the outcome. Leading indicators can be more challenging to measure than lagging indicators, but they’re easier to influence and coach on. You can’t change last quarter’s revenue, but you can help a rep refine their discovery call today.
Lagging Indicators
A lagging indicator reflects your ultimate results.
They‘re reactive, not proactive. For instance, a lagging indicator might be your team’s quota attainment at the end of the month. After seeing the lagging indicators, creating or revisiting your sales plan can help you improve your results in the future.
SaaS Sales Metrics
Software as a service (SaaS) is a software distribution model that provides customers with access to cloud-based applications online instead of requiring physical media and custom installation.
As subscription-based businesses often serving other businesses, SaaS businesses require different metrics.
Key SaaS Sales KPIs to Track
- Customer Acquisition Cost
- Cost per Acquisition
- Customer Lifetime Value (LTV)
- Average Revenue per User or Account
- Monthly Recurring Revenue (MRR)
- Annual Recurring Revenue
- Churn Rate
- Revenue Churn
- Negative Churn
1. Customer Acquisition Cost
Measures: Sales performance and effectiveness
Who this sales metric is helpful for: BDRs, SDRs, sales managers+
Customer acquisition cost (CAC) is the average amount of sales and marketing expenses required to acquire one new customer. You’ve heard it said that acquiring a new customer is generally about three times more expensive than retaining new one. In my time in SaaS sales, I’ve found this to be absolutely true. The cost of acquiring new customers for merchants has risen dramatically in recent years, with a 222% increase over the past eight years.
Customer acquisition cost is a big factor in determining whether a company needs to adjust its strategy for pursuing new customer logos, or if they should stay the course.
Here are some potential components of your CAC:
- Inbound marketing (blogging, SEO, social media)
- Sales and business development
- Paid advertising
- Events and trade shows
How to Calculate CAC
To calculate CAC, divide the total amount you spent on sales and marketing in a given period by the number of customers you acquired in that same period.
(Cost of sales + cost of marketing) / Number of new customers = customer acquisition cost
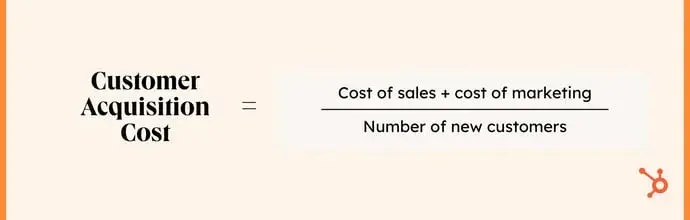
For example, if you spent $1,000 in one month and acquired 50 customers, your CAC would be 20.
This formula is easy to follow, and the result of your equation lets you know if any aspects of your acquisition strategy need optimizing so you’re not spending more than you bring in.
Just keep in mind to adjust this formula for your average length of sales cycle, instead of analyzing the number month by month. To address this, I recommend following HubSpot's former VP of Growth Brian Balfour’s CAC formula:
CAC = (Marketing Expenses (n-60) + 1/2 Sales (n-30) + ½ Sales (n)) / New Customers (n), where n= Current Month
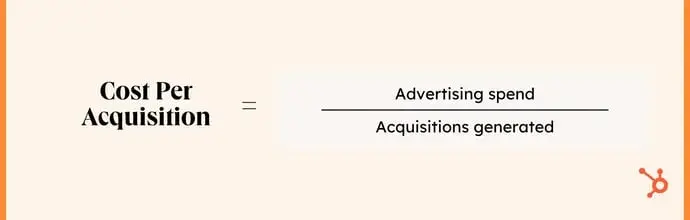
2. Cost per Acquisition
Measures: Sales performance and effectiveness
Who this sales metric is helpful for: BDRs, SDRs, sales managers+
Balfour also points out that people commonly conflate customer acquisition cost with"cost per acquisition — but the two are different, and mistaking them can be costly.
CPA represents how much money you need to spend to acquire a non-customer, like a lead, a free trial, a registration, or a user.
This means CPA and CAC are related: Your CPA is a leading indicator of your CAC.
For example, if you offer a freemium version of your software product, your CPA would measure the cost of acquiring a free user. Your CAC would measure the cost of acquiring a paid user.
Cost Per Acquisition = Advertising spend / Acquisitions generated
Months to Recover CAC
SaaS companies must know how many months it takes to recover CAC and the amount they invested in getting a new customer.
Not only does this metric help you manage cash flow, but it also tells you how long you need to retain a customer to break even.
Let's say your CAC is $200, and your Average Revenue Per User or Account (ARPU/ARPA) is $400. Your gross margin is 95%.
Months to recover CAC = CAC divided by (ARPA x GM)
In this example, you'd break even in approximately two weeks.
3. Customer Lifetime Value (LTV)
Measures: Sales performance and effectiveness
Who this sales metric is helpful for: Account managers, sales managers+
Customer lifetime value (LTV) is the average amount of money your company makes from an individual buyer for however long they stay a customer (i.e., X months or years).
LTV tells you whether you‘re spending too much or too little on acquiring customers. The optimal LTV:CAC ratio is 3:1. In other words, if it takes a dollar to get a prospect to buy your product, they’ll spend $3 over their time as a customer.
Segment your customers, then look at the average LTV. The findings will tell you where to focus your energy and/or change your strategy. For example, if Tier X of accounts has a 1.5:1 LTV:CAC ratio, while Tier Y has a 4:1 ratio, you'd probably want to:
- Decrease your marketing and sales expenses for Tier X and increase them for Tier Y.
- Figure out why Tier X customers are less profitable — are they churning earlier, buying less, and/or purchasing fewer add-ons?
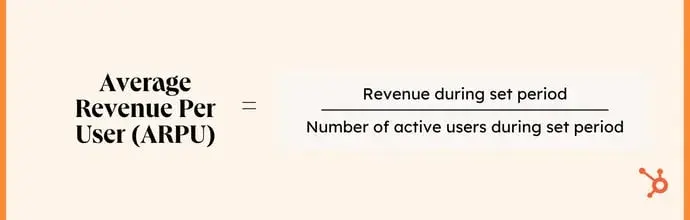
4. Average Revenue per User or Account
Measures: Sales performance and effectiveness
Who this sales metric is helpful for: Account managers, sales managers+
Average revenue per user or account (ARPU/ARPA) is the mean amount of revenue from a single user or customer. You can calculate it per month or year, depending on your business model.
If you offer monthly contracts, calculate it per month; if most of your contracts are annual, calculate it per year. This is the standard ARPU formula that I always use:
ARPU = Revenue during set period / Number of active users/accounts during set period
5. Monthly Recurring Revenue (MRR)
Monthly recurring revenue (MRR) tracks the total predictable revenue your company expects to make each month. This was a valuable sales metrics I used while selling for IBM, since it reflected growth and helped me forecast future revenue.
How to Calculate MRR
There are two ways to calculate MRR:
- Add up the monthly revenue you're bringing in from each customer for the total MRR.
- Multiply ARPA/ARPU by your number of paying customers.
The first method takes longer but is also more accurate. If Customer X is paying $200 per month, and Customer Y is paying $400 per month, your MRR would be $600.
The second method is easier. If you have four customers, and your ARPA is $150, your MRR would be $600. This is the formula to use for yourself:
MRR = Average Revenue Per Account/User x Total Accounts That Month
Make sure you're not including one-time payments in your MRR, like implementation and/or limited support fees.
Be careful about quarterly, semi-annual, and annual plans as well. Let's say a new customer signs a $1,200 year-long contract in December.
If you tally up your MRR on a customer-by-customer basis that month, you might incorrectly add $1,200. But you‘re not generating $1,200 from this account each month — you’re generating $100.
To include these subscription values in your MRR, divide them by four, six, or twelve if they're quarterly, semi-annual, or yearly, respectively.
There are different types of monthly recurring revenues you can calculate: new MRR, expansion MRR, and churn MRR.
New MRR
New MRR refers to revenue from new customers. Suppose you acquired one customer paying $50 monthly and a second customer paying $45 monthly. Your new MRR would equal $95 per month.
New MRR Formula = New MRR + Expansion MRR - Churned MRR
Expansion MRR
Expansion MRR is revenue generated from existing customers, including cross-sells (buying complementary products or services), upgrades/upsells (a more expensive plan), and greater volume (buying more seats, usage data, transactions, etc.)
Expansion MRR is considered the “holy grail” of MRR. Why? It‘s commonly known that retaining an existing customer is five to 25 times less expensive than acquiring a new one. Plus, customers are far less likely to churn when they’ve invested more into your suite over time.
Churn MRR
Churn MRR is the revenue you‘ve lost from customers who have downgraded their plans or canceled altogether. It’s a leading indicator of next month's MRR. For example, if two customers (each paying $400) canceled in June, your MRR would be $800 lower in July.
6. Annual Recurring Revenue (ARR)
Measures: Sales performance and effectiveness
Who this sales metric is helpful for: Sales managers+
Annual recurring revenue is your MRR multiplied by 12 or the recurring revenue you'll generate in a calendar year.
I’ve always found that ARR has a significant advantage over MRR. Because salespeople typically sell more during longer months (like March, August, and December) and sell less during shorter months (like February, June, and April), your predicted MRR might be off from month to month. This can also account for industries with seasonal sales cycles, like education.
Should you focus on MRR or ARR?
The short answer is that you should focus on both. While MRR tells you how your business is doing right now, ARR gives you an annual picture.
Your priority should depend on your company's maturity and business model. A shorter-term lens can be helpful for startups who need a short-term lens. Unicorns and enterprises generating more than $10 million each year should think in terms of ARR.
Free Sales Metrics Calculator
A free, interactive template to calculate your sales KPIs.
- Average Deal Size
- Customer Acquisition Cost (CAC)
- Customer Lifetime Value (CLV)
- And more!
Download Free
All fields are required.
Form not available
7. Churn Rate in SaaS
Measures: Sales performance and effectiveness
Who this sales metric is helpful for: Account managers, BDRs, SDRs, sales managers+
Your churn rate is the percentage of customers who cancel their recurring subscriptions. You can calculate per month, quarter, or year, depending on your most common contract type.
The formula for churn rate is:
(# of customers lost in a given time period) / # total customers at the beginning of a given time period
Imagine the majority of your customers are on semi-annual plans. In January, you have 400 customers. In June, you have 500 customers.
Your churn rate equals: -100 / 500, or -20%. You‘re gaining more customers than you’re losing.
8. Revenue Churn
Measures: Sales performance and effectiveness
Who this sales metric is helpful for: Sales managers+
Churn is never ideal.
However, revenue churn is different from customer churn. Revenue churn is the amount of revenue you‘ve lost (a.k.a. churn MRR), while customer churn is the number of customers you’ve lost.
From a business standpoint, it's probably preferable to lose three customers, each paying $40 per month, than one customer paying $300 per month.
9. Negative Churn
Negative churn is a term popularized by David Skok that means your expansion MRR exceeds your churn MRR. If you can achieve negative churn, your business will grow exponentially.
Measures: Sales performance and effectiveness
Who this sales metric is helpful for: Sales managers+
Negative churn means that your expansion MRR exceeds your churn MRR. If you can achieve negative churn, your business will grow exponentially.
Sales KPIs by Team Type
You can also look at sales KPIs by the type of team you have. Inside sales, field sales, and sales development have different metrics to measure.
Inside Sales KPIs
Inside sales teams rely on these KPIs (from most frequently used to least):
- Number of deals closed.
- Opportunities by stage.
- Calls.
- Meetings.
- Significant interactions or events (for example, ROI meetings or conversations lasting four-plus minutes).
- Opportunities created.
- Demos.
- Quotes/proposals.
- Emails.
- Meetings scheduled.
Field Sales KPIs
Outside sales teams use many of the same metrics as inside sales teams, but prioritize activities and meetings more heavily.
- Meetings
- Number of deals closed
- Opportunities created
- Opportunities by stage
- Quotes/proposals
- Significant interactions or events
- Calls
- Demos
- Emails
Sales Development Metrics
Managing a sales development team? Use these SDR metrics to benchmark your team’s efficiency and ability to grow the pipeline.
- Meetings
- Calls
- Opportunities created
- Significant interactions or events
- Opportunities by stage
- Number of deals closed (by their partner Account Executive)
- Demos
- Emails
- Meetings scheduled
I’ve covered a lot of metrics so far — luckily, you don’t have to keep track of them manually. A sales metrics dashboard can compile these insights in an easy-to-scan format.
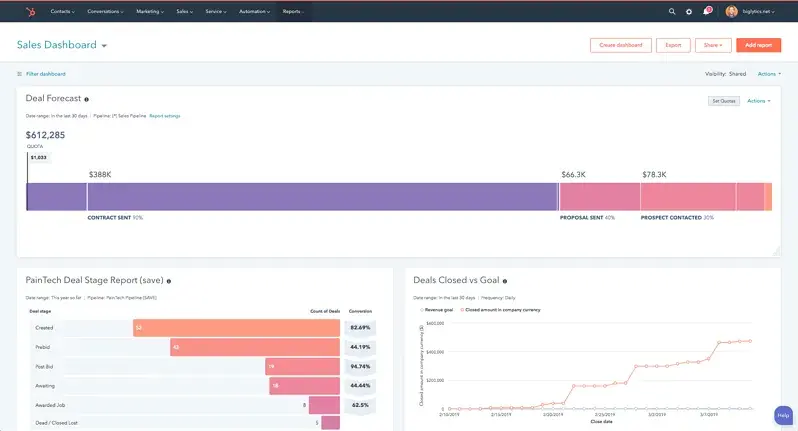
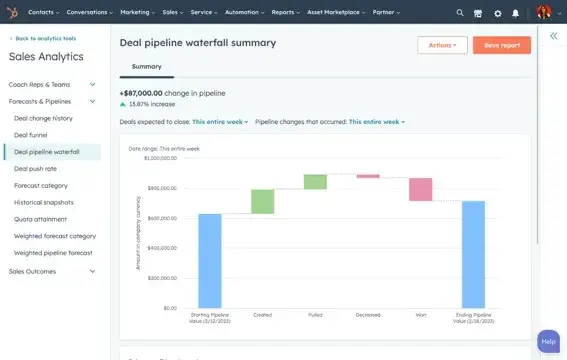
Sales Metrics Dashboard
A sales metrics dashboard visualizes your business's sales data and metrics. It can offer a variety of reports and displays for your sales leaders and reps to review, analyze, and act on.
Here’s an example of a dashboard:
CRMs like HubSpot come with dashboards built into the system. Alongside templated sales dashboards, you can build custom reports to track your most important sales metrics.
Learn how to create custom reports with HubSpot's Reporting Dashboard through a free demo.
Let’s review some metrics you’d track on a dashboard.
1. Sales Performance by Rep
A little friendly competition can motivate your team to pick up the pace and reach their quotas. Create a leaderboard to track your top performers. Pick your sales metrics based on the behavior you want to promote; for example, if you’re trying to increase your team’s prospecting efforts, you might display the number of total opportunities created in the last month.
To ensure your reps don't chase unqualified leads simply to fill their pipelines, you might also display total sales by rep.
2. Sales Activities
Keep your reps focused on the right tasks with an activities dashboard. Show how many days in a row they’ve logged into the CRM or other key activities: numbers of calls made, demos, emails sent, etc.
3. Sales Management
As a sales manager, you need to know how your team is trending. Track the value of new opportunities compared to the previous month or quarter, the weighted value of your pipeline, total sales versus your target, or close rate by salesperson.
4. Funnel Reports
Make sure you know your pipeline at every stage. Know how many contacts have been created, how many have been assigned, and how many are still in the sales funnel so that you can make better decisions for the team and set new goals. It can also help you identify and diagnose friction points in the sales funnel.
If you’re not ready to invest in a CRM that offers a sales metrics dashboard, I recommend using a sales KPI template that you can compile into a spreadsheet.
Sales KPI Template
If there’s one thing I learned as a sales rep, it’s not to reinvent the wheel when there are blueprints and templates that can make your life easier. A sales metrics calculator gives you an easy way to track your sales metrics in a single place.
This KPI calculator is customizable to your business goals. It includes tabs for different KPIs that you can then track monthly, quarterly, or yearly.
I use HubSpot’s sales metrics calculator to track the following KPIs:
- Average Deal Size. Your company’s total revenue divided by the number of deals closed in a month, quarter, or year.
- Win Rate. The number of deals won versus the number of deals lost.
- Demo-to-Close Ratio. The number of demos that were carried out divided by the number of deals that were won.
- Quota Setting Calculator. On-target earnings (OTE) multiplied by five.
- Commission Calculator. The total amount you’ll pay out in commissions to your sales reps.
- Customer Acquisition Cost (CAC). The amount spent on sales and marketing efforts, divided by the number of customers acquired.
- Customer Lifetime Value (CLV). Average annual revenue per customer divided by the average lifetime of a customer.
- Revenue by Product. Amount of income generated per product.
- Customer Retention Rate. The percentage of customers who stay with your business.
- Revenue Churn. The amount of revenue that’s lost in a month, quarter, or year.
- Employee Turnover Rate. The percentage of sales reps who leave your team.
Track sales metrics to increase efficiency and grow better.
Over my decade in sales— from IBM and beyond— I’ve learned that sales metrics aren’t just numbers— they’re signals. Track leading indicators like lead follow-up and pipeline quality to shape tomorrow’s results, but never lose sight of lagging outcomes like win rate and customer lifetime value to understand if your strategies are truly working. Then, use your insights to sell smarter, sell better, and grow sustainably.
Editor's note: This post was originally published in September 2019 and has been updated for comprehensiveness.
Free Sales Metrics Calculator
A free, interactive template to calculate your sales KPIs.
- Average Deal Size
- Customer Acquisition Cost (CAC)
- Customer Lifetime Value (CLV)
- And more!
Download Free
All fields are required.
Form not available


![Want to create a sales plan? Let me show you how [+8 sales plan examples]](https://53.fs1.hubspotusercontent-na1.net/hubfs/53/sales-plan-1-20260323-5097831.webp)


![10 Important Sales Analysis Reports [+ 4 Sales Report Templates]](https://53.fs1.hubspotusercontent-na1.net/hubfs/53/Sales-Analysis-Reports-1-20241007-6831164.webp)