
If you’re writing a blog for a business, those stats make blog SEO a pretty big deal.
Whenever I approach a post, I keep SEO in mind — even if I’m just writing on my personal blog for fun. A strong SEO strategy helps me boost my message and connect with more engaged readers.
But what is blog SEO? And how can you optimize your blog for search engines?
Get ready for an in-depth exploration into the world of keywords, backlinks, and content optimization.
.png)
6 Free Blog Post Templates
Save time creating blog posts with these free templates.
- "How-to" Post
- "What is" Post
- Listicle Post
- And More!
Download Free
All fields are required.
What is blog SEO?
Blog SEO is the practice of creating and updating a blog to improve search engine rankings. This approach usually includes keyword research, link building, image optimization, and content writing.
Does blogging help with SEO?
Blogging helps boost SEO quality by positioning your website as a relevant answer to your customers' questions. Blog posts that use a variety of on-page SEO tactics can give you more opportunities to rank in search engines and make your site more appealing to visitors.
In my experience, optimizing my blog increased my reach.
When you optimize your web pages — including your blog posts — you’re making your website more visible to people who are using search engines (like Google) to find your product or service.
But does your blog content really help your business organically rank on search engines?
Why does blogging improve search engine optimization?
Google and other search engines use ranking factors to figure out what results come up for each search query. It also decides how to rank those results.
Blogging can help you optimize your site for important Google ranking factors like the following.
Organic Click-Through Rate
Blogging helps you create relevant content for more keywords than other kinds of pages do, which can improve your organic clicks.
For example, a person who clicks on a landing page usually has transactional intent. This means that the person is clicking because they’re ready to convert.
But, people search online for many different reasons. And a blog has the potential to answer navigational, informational, and transactional search queries.
Creating content for more types of search can increase clicks to your pages, which can improve your SEO.
Index Coverage
Google can’t rank a page that it hasn’t indexed.
Indexing means a search engine finds content and adds it to its index. Later, the page can be retrieved and displayed in the SERP when a user searches for keywords related to the indexed page.
So, it’s important to create relevant and link-worthy content to encourage Google to crawl your site pages.
One way to do this is to constantly add fresh content to your site. A blog gives you a reason to post new content to your site on a regular basis, which encourages more frequent indexing.
Backlinks
When other websites link to pages on your website, it shows search engines that your content is useful and authoritative.
Backlinks are a sort of peer review system online. If your blog gets backlinks from respected sites, it’s more likely that your website will rank in search results.
Because blog posts are likely to educate or inform users, they tend to attract more quality backlinks.
Internal Links
When you link from one page on your site to another, you’re creating a clear path for users to follow.
Internal links can also make it easier for people to find the content on your site they’re looking for. These links also help search engine crawlers figure out the organization of your site.
A blog creates more site pages that you can link to internally. It also gives you a chance to direct site traffic to other pages that can help your users.
For example, say I run a lawn maintenance company and offer lawn mowing services. Someone searching for a lawn mower wouldn’t find my services online because that’s not what they’re looking for (yet).
But say I write blogs about the best lawnmowers, lawn mowing challenges, or pest control for lawns. Those posts make my website easier to find.
And if someone looking for lawnmowers decides they want an easier option, they could be a good candidate for my services. I can help them visit other pages on my site through internal links.
These are just a few of the many reasons that blogging is good for SEO. Blogging lets you share useful information with your audience. It can draw new customers and engage current customers.
Creating a blog can help you build trust, boost sales and leads, and improve your search engine optimization.
What is blog SEO strategy?
Blog SEO strategy is a comprehensive plan to improve organic search results. This plan might include competitive research, keyword lists, or an optimization proposal.
Search engines make frequent updates. Business goals can change quickly too.
But it can take an average of three to six months for a post to rank on Google. Without a strategy, you might find yourself investing in your blog but not seeing a boost in SEO.
A strategy can help you measure whether your ideas and efforts are effective. It can also help you make the most of your team’s time and resources. This post can help you develop your SEO strategy if you’re not sure where to start.
6 Free Blog Post Templates
Save time creating blog posts with these free templates.
- "How-to" Post
- "What is" Post
- Listicle Post
- And More!
Download Free
All fields are required.
Blog SEO Best Practices
Now that we’ve covered the basics of SEO in blogging, I wanted to share some best practices that I use regularly as a blogger for HubSpot. Let’s dive in.
1. Identify the target audience for your blog.
No matter what I’m writing about, I find and speak directly to the primary audience that will be reading my content. If I know who my audience is, I can better pair the right offers with my content and drive connection with my readers.

Buyer personas are an effective way to target readers using their buying behaviors, demographics, and psychographics.
Without this insight, I could be producing grammatically correct and accurate content that few people will click on because it doesn’t speak to them on a personal level.
2. Conduct keyword research.
Now that I’ve selected my target audience and prepared a buyer persona, it’s time to find out what content my readers want to consume.
I always start with the topics my blog will cover, then expand or contract my scope from there. For an in-depth tutorial, check out our how-to guide on keyword research.
Quick tips for keyword success:
- Find keywords with opportunity. If a keyword already gets 10,000+ searches per month, it’s hard to make inroads with new content. Similarly, keywords with no search volume won’t suddenly spike just because you write great content. I look for keywords that are searched for but not oversaturated.
- Go long, not short. Longer-tail keywords — those consisting of three words or more — tend to outperform shorter options. They’re also less likely to be oversaturated in existing content. I often target these in my posts when relevant.
- Keep keywords updated. Over time, the search intent of my customer base may shift. I regularly reassess keyword rankings and search volumes to ensure I’m effectively targeting my audience.
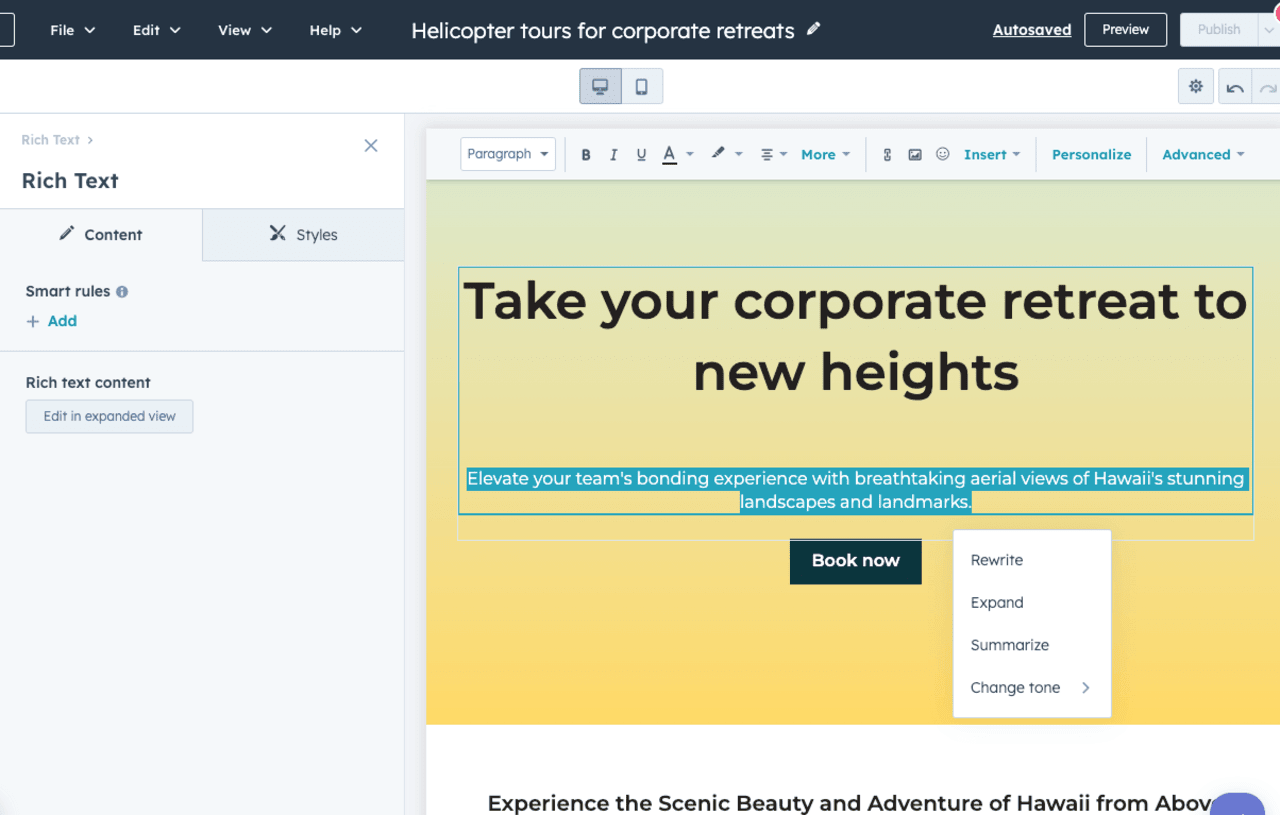
3. Add visuals.
Search engines like Google value visuals for certain keywords. Images and videos are among the most common visual elements that appear on the search engine results page (SERP).
In order to achieve a coveted spot in an image pack or a video snippet, I design creative graphics, use original photos and videos, and add descriptive alt text to every visual element within your blog post.
Alt text is a major factor that determines whether or not my image or video appears in the SERP and how highly it appears.
Alt text is also important for screen readers so that visually impaired individuals have a positive experience consuming content on my blog site.
I make sure my alt text contains both relevant keywords and a vivid description of what’s in the images. That benefits my search rankings and my ability to serve my audience.
4. Write a catchy title.
The title of my blog post is the first element a reader will see when they come across my article, and it heavily influences whether they’ll click or keep scrolling.
A catchy title uses data, asks a question, or leads with curiosity to pique the reader’s interest.
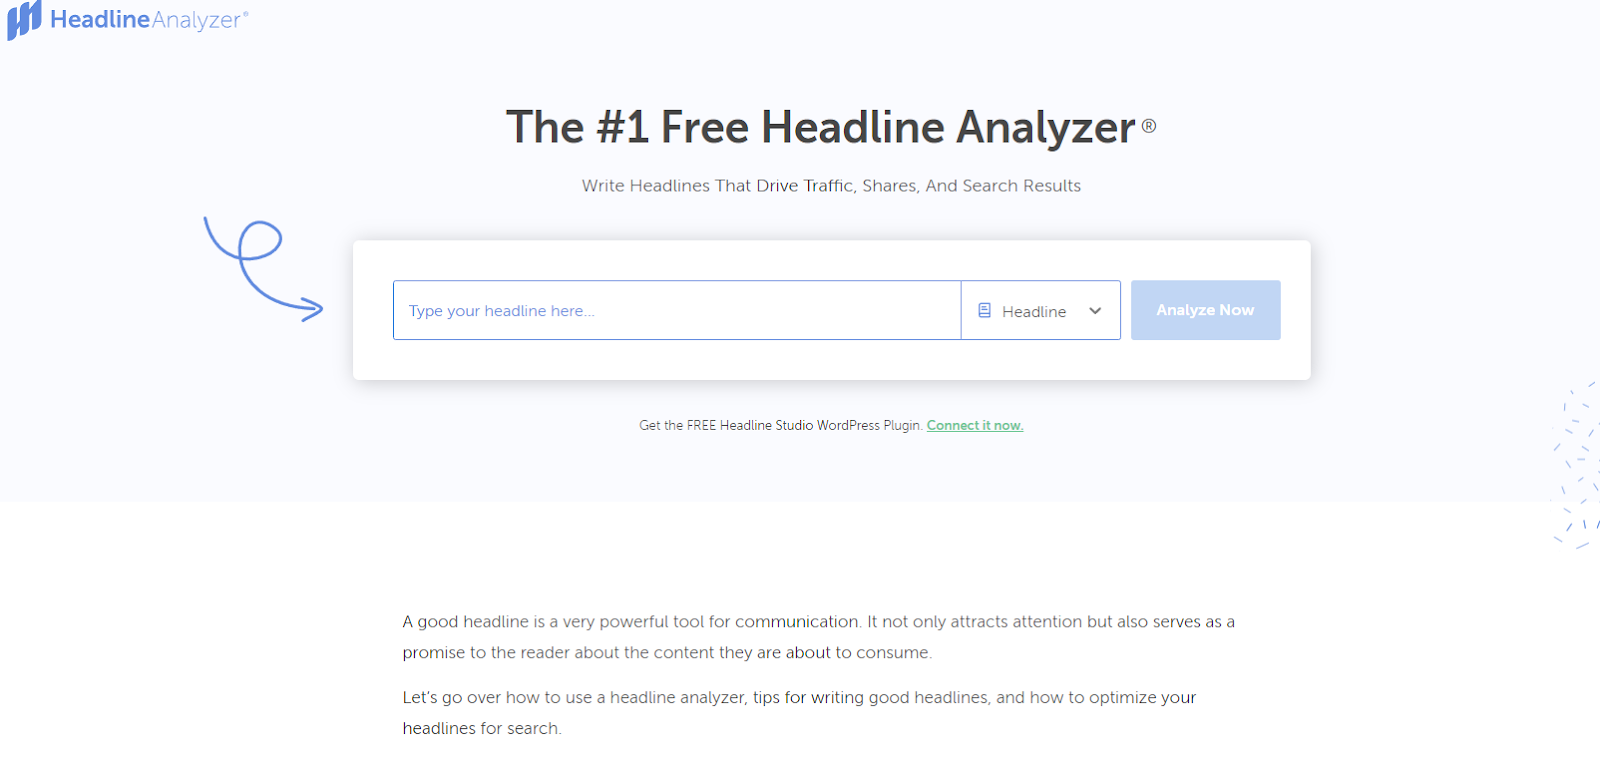
According to Coscheduler’s Headline Analyzer, the elements of a catchy title include power, emotional, uncommon, and common words.
In the right proportions, these types of words in a blog title grab my readers’ attention and keep them on the page.
To show the importance of a good title, I wrote a sample headline and ran it through Coschedule Headline Analyzer. How did “The Perfect Dress Has 3 Elements According to This Popular Fashion Expert” score? It got an 87. Here’s why.
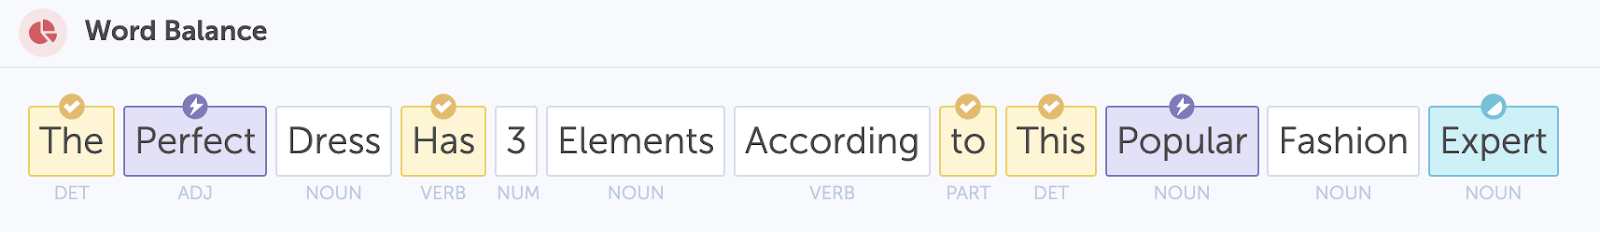
- Highlighted in yellow are common words. They’re familiar to the reader and don’t stray too far from other titles that may appear in the SERP.
- “Expert” is an emotional word, according to Coschedule. In this example, the word expert builds trust with the reader and tells them that this article has an authoritative point of view.
- Purple words are power words — this means they capture the readers’ attention and get them curious about the topic.
- Another element in this title is the number three. This signals to the reader that they’ll learn a specific amount of facts about the perfect dress.
5. Include an enticing CTA.
What’s a blog post without a call-to-action? The purpose of a CTA is to lead my reader to the next step in their journey through my blog.
The key to a great CTA is that it’s relevant to the topic of my existing blog post and flows naturally with the rest of the content.
Whether I’m selling a product, offering a newsletter subscription, or wanting the reader to consume more of my content, I’ll need an enticing CTA on every blog post I publish.
CTAs come in all types of formats, so I recommend getting creative and experimenting with them. Buttons, hyperlinks, and widgets are some of the most common CTAs, and they all have different purposes.
For instance, I often add a bold, visible CTA, like a button, if I want the reader to make a purchase. On the other hand, I can easily get a reader to check out another blog post by providing a hyperlink to it at the conclusion of the article.
6. Focus on the reader’s experience.
Any great writer or SEO will tell you that the reader experience is the most important part of a blog post.
The reader experience includes several factors, like readability, formatting, and page speed. That means you’ll want to write content that’s clear, comprehensive of your topic, and accurate according to the latest data and trends.
Organizing the content using headings and subheadings is important as well because it helps the reader scan the content quickly to find the information they need.
Finally, on-page elements like images and videos have an impact on page speed. Keep image file sizes low (250 KB is a good starting point) and limit the number of videos you embed on a single page.
By focusing on what the reader wants to know and organizing the post to achieve that goal, I can publish articles optimized for the search engine.
Even with the best intentions and meticulous attention to detail, there’s always a chance of minor errors creeping into your content or your message not being as clear or accurate as it could be.
I have found hiring a professional editing service can be an effective way to ensure your blog post is polished, readable, and error-free.
This not only enhances the reader experience but also lends my content greater credibility.
Editors can help fine-tune my content, ensuring it adheres to the latest SEO trends and practices, while also checking for grammatical accuracy, cohesiveness, and clarity of thought.
7. Use a simple structure.
For best reader results, keep things simple. I try to avoid long text walls by using paragraphs that are three to four sentences long. I put important information up top, so I don’t bury the lede.
My first sentence in this section wasn’t a tangential observation or a poorly contrived joke. Instead, it was a clear statement of fact.
Here are three more tips to help keep things simple:
- Use headings and subheadings.
- Keep sentences short and to the point.
- Incorporate bulleted lists or images to break up long sections of text.
I’ve done both here — there’s an image under the header, and I’ve used a list for easy reading.
If this was one large wall of text, it’s far less likely you’d bother to read it all. You might skim for the details but miss critical points because the structure wasn’t solid.
8. Choose quality over quantity.
While Google and other search engines tend to prefer longer blog pieces — the one you’re reading right now comes in at over 8,000 words — I won’t always have the time or resources to build out big blog pieces.
To make the most of my content, I always opt for quality over quantity. In practice, this means I don’t add words simply to reach an arbitrary total.
If I have a strong introduction, hit the salient points, and include a solid CTA, I don’t stuff in more content (keywords or otherwise). Instead, I optimize and publish what I have.
Worth noting? There is a lower limit for effective blog content. Posts with fewer than 300 words tend to fly under the search engine radar.
While there’s nothing wrong with the occasional post that dips below 300, aim for a baseline of 500 or more to keep engines interested.
9. Get a second opinion.
As a writer with more than a decade’s worth of experience, I’m confident in my ability to create great content.
The caveat? I don’t always get it right on the first try.
Sometimes, I miss the mark on structure — I might get a little wordy or create content that’s factually correct but hard to read. I might not stick the landing on tone of voice or make a mistake when it comes to search intent.
This is where second opinions shine. In my case, it’s typically an editor reviewing my work to find areas for improvement.
In your business, it might be a partner or colleague who takes a look at your blog post with fresh eyes and offers constructive criticism.
10. Leverage existing content.
Existing content can also help boost blog SEO. If I have posts that are relevant to a topic, I make sure to link them in my new content.
Let’s say I run a window-washing service. Old content about the basics of washing windows and keeping them clean is effectively evergreen and is a great way to connect new pieces and older work.
I may also have posts that are out-of-date but still contain good advice or actionable tips. In this case, I take the time to review and edit existing content.
Even if I only keep half a post, I can build a new post around the core concept and save myself the time of creating a new article from scratch.
11. Create a clear strategy.
What is the goal of your business blog?
The typical answer here is a mix of awareness and action.
First, companies want prospective customers to engage with their brand by reading blog posts and coming back for new content. Next, they want buyers to click through on CTAs or fill out contact forms for more information.
When you’re building your blog audience, however, it’s best to pick a lane. If your business is relatively new or if this is your first foray into writing blogs and engaging with customers through written content, focus on awareness.
Write content that captures user attention, and post this content on all social media channels.
If you have a solid audience combined with reliable word-of-mouth, you can opt for shorter pieces that encourage readers to contact your company for a quote, take advantage of sale pricing, or access a new product.
Content planning tools simplify creating a clear blog strategy by helping organize and schedule posts to meet business goals. They offer features like topic ideas, editorial calendars, and performance tracking, ensuring consistent, targeted content.
12. Audit your website.
A well-optimized blog post can only take you far in search results — the overall quality of your website will also have a significant impact on how future content will rank on organic search listings. That’s why regularly auditing your website is so important.
Use website graders to check if the rest of your website is up to SEO standards and spot any technical hiccups that might impact your rankings. While you’re at it, also monitor your domain authority (DA).
In short, DA tells you how much influence your website has over search engines with your competitors. A high DA score lets Google know your website is a trustworthy source of information within your niche — your content will tend to naturally rank higher compared to competitors with lower DA scores.
Also, keep in mind that SEO doesn’t just involve traditional search engines like Google or Bing anymore. With the number of users that leverage chatbots like ChatGPT and Perplexitiy to find answers to their queries, AI assistants have become solid search engines of their own — and your website can have a lot of influence over them too.
For example, HubSpot’s AI Search Grader lets you check if your brand is visible in AI search engines whenever users type in something related to your products or services. If it is, the tool will also let you know what kind of information AI assistants display about your brand — be it positive, negative, or neutral.
6 Free Blog Post Templates
Save time creating blog posts with these free templates.
- "How-to" Post
- "What is" Post
- Listicle Post
- And More!
Download Free
All fields are required.
Factors That Affect Blog SEO
Although it’s clear blog content does contribute to your SEO, Google’s many algorithm updates can make publishing the right kind of blog content tricky if you don’t know where to start.
Some blog ranking factors have stood the test of time while others are considered “old-school.” Here I’ll go over a few of the top-ranking factors that can, directly and indirectly, affect blog SEO.
1. Dwell Time
Although dwell time is an indirect ranking factor for Google, it’s a critical factor in the user experience — and we know that user experience is king when it comes to SEO.
Dwell time is the length of time a reader spends on a page on your blog site. From the moment a visitor clicks on your site in the SERP, to the moment they exit the page is considered dwell time.
This metric indirectly tells search engines like Google how valuable your content is to the reader. It makes sense that the longer they spend on the page, the more relevant it is to them.
However, there’s a reason this metric is an indirect indicator for SEO — it’s completely subjective. The search engine algorithms don’t know your content strategy.
Your blog could be focused on short-form content that takes just a minute or two to read. You might also include pertinent information at the beginning of your blog posts to give the best reader experience, which means less time spent on the page.
So yes, dwell time can affect SEO, but don’t manipulate your content to change this metric if it doesn’t make sense for your content strategy.
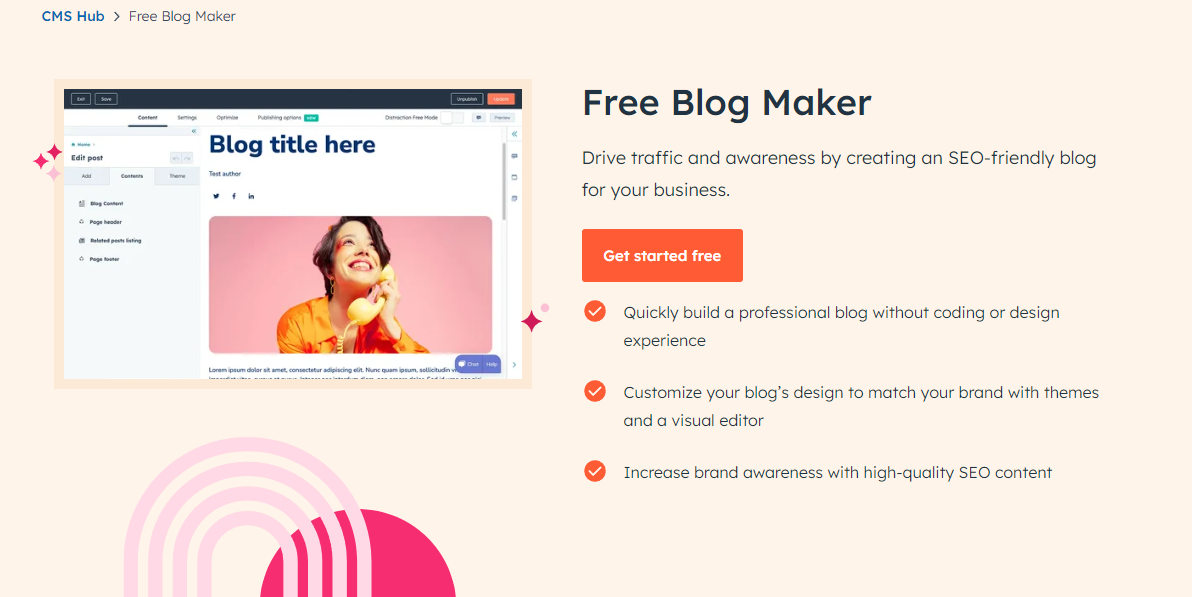
HubSpot allows you to publish quality content with a free blog maker that widens your brand’s reach and grows your audience.
2. Page Speed
I mentioned earlier that visual elements on your blog can affect page speed, but that isn’t the only thing that can move this needle. Unnecessary code and overuse of plugins can also contribute to a sluggish blog site.
Removing junk code can help your pages load faster, thus improving page speed.
If you’re not sure how to find and remove junk code, check out HTML-Cleaner. It’s an easy-to-use tool that doesn’t require coding knowledge. It simply shows you the unnecessary code and lets you remove it with the click of a button.
I also recommend taking an inventory of your blog site plugins. Decide which ones you need to keep your blog running day-to-day and which ones were installed as a fix for a temporary issue.
Plugins that affect the front end of your site are a threat to page speed, and odds are, you can uninstall more of these plugins than you think to increase your overall site speed.
3. Mobile Responsiveness
More than half of Google’s search traffic in the United States comes from mobile devices. On an individual level, your blog site might follow that same trend.
There’s no way around it — optimizing your blog site for mobile is a factor that will affect your SEO metrics.
But what exactly does it mean to optimize a website for mobile? The industry rule of thumb is to keep things simple.
Most pre-made site themes these days are already mobile-friendly, so all you’ll need to do is tweak a CTA button here and enlarge a font size there.
Then, keep an eye on how your site is performing on mobile by taking a look at your Google Analytics dashboard and running a mobile site speed test regularly.
4. Index Date
Search engines aim to provide the most relevant and accurate information available. A factor search engines use when determining what’s relevant and accurate is the date a search engine indexes the content.
You might be wondering: Is the date the content was indexed the same as the date it was published?
The answer: yes and no. If a blog post is published for the first time, it’s likely that a Google crawler will index that post the same day you publish it.
But, content can be backdated for several legitimate reasons, too, like archiving information or updating a sentence or two.
One way to positively affect this SEO factor is to implement a historical optimization strategy. This strategy works well on blogs that have been established for a few years and have a fair amount of content already.
By updating these older posts with new perspectives and data, you’ll be able to significantly impact your blog SEO without creating a lot of net new content.
Site crawlers will reindex the page — taking into account the updated content — and give it another opportunity to compete in the SERP. It’s truly a win-win.
6 Free Blog Post Templates
Save time creating blog posts with these free templates.
- "How-to" Post
- "What is" Post
- Listicle Post
- And More!
Download Free
All fields are required.
5. Recent Data
Recent data, another indirect ranking factor of SEO, should be included in blog posts. Recent data gives visitors relevant and accurate information which makes for a positive reader experience.
When you include a link to a credible site that has original, up-to-date data, you’re telling the search engine that this site is helpful and relevant to your readers (which is a plus for that other site).
You’re also telling the search engine that this type of data is in some way related to the content you publish.
Over time, your readers will come to appreciate the content, which can be confirmed using other metrics like increased time on page or lower bounce rate.
Pro tip: As a rule of thumb, take time to understand what each of these factors does, but don’t try to implement them all at once. They each serve a specific purpose and should be used to meet a specific SEO goal for your blog.
Listen to HubSpot’s Matt Barby and Victor Pan take on this topic in this podcast episode.
How to Optimize Blog Content for Search Engines
- Choose blog topics with keyword research.
- Write a compelling blog post title.
- Outline your blog post with SEO in mind.
- Use keywords strategically throughout the blog post.
- Make sure your blog post covers your topic completely.
- Add SEO-optimized images and videos.
- Include image alt text.
- Link to related blog posts.
- Optimize the meta description.
- Review metrics regularly.
1. Choose blog topics with keyword research.
Your blog topics should start with your customers’ most important questions and concerns.
But if you want those customers to find your content, you need to use the same keywords that they use to find answers. You can find these words by doing keyword research.
In my experience, keyword research tools can also help you find new topics to write about and grab the interest of new audiences.
As you search for the right keywords for your blog, think about search intent.
While some people are searching for your products to use right away, others may be at a different point in the buyer’s journey. So, it’s a good idea to have a mix of focus keywords.
Keyword tools can help you find and narrow down your list of keywords so that you’re writing the right blogs for your target audience. If you’re struggling with ideas, tools like HubSpot’s Blog Ideas Generator can kickstart the process — they topics and titles based on your input, like specifying your main keyword or a few details about your content.
You also have the option to see each generated topic’s search volume to increase the likelihood of having your content rank high in organic search results.
2. Write a compelling blog post title.
Writing titles is tough. As a writer, I know the importance of crafting the perfect title that catches reader interest and promises what’s delivered in the article.
Many blog writers spend time writing a blog post then quickly add a title when they’re done and hope for the best. But blog titles have a bigger impact than you might think.
First, titles tell your audience what to expect from your post. If your blog title is a smart and catchy question that your post doesn’t answer, you’ll have a lot of unhappy readers.
Next, your blog title is what makes searchers want to read your post. It doesn’t matter how well-written and researched a blog post is if the title doesn’t spark interest.
Title Tag
Finally, titles are essential for blog SEO. This is a place to feature your keywords in an authentic way. Google calls this the “title tag” in a search result.
Be sure to include your keyword within the first 60 characters of your title, which is just about where Google cuts titles off on the SERP.
Technically, Google measures by pixel width, not character count. It recently increased the pixel width for organic search results from approximately 500 pixels to 600 pixels, which translates to around 60 characters.
Long title tag? When you have a lengthy headline, it’s a good idea to get your keyword in the beginning since it might get cut off in SERPs toward the end, which can take a toll on your post’s perceived relevance.
In the example below, we had a long title that went over 65 characters, so we placed the keyword near the front.
It’s also important to look at the SERP results for your keyword when you’re writing your post titles.
This research will help you understand the most popular results for your keywords. It will also give you a better sense of what searchers are hoping to find when they click on your post.
As you write your blog titles, use words that have emotional appeal. You might want to add numbers or statistics to emphasize a point. Avoid salesy language, or your post might seem like spam.
These title tips offer more advice for creating great blog titles.
3. Outline your blog post with SEO in mind.
If you’re used to writing blog posts from your imagination with a free flow of ideas, blog SEO might sound like a challenge. But anyone can create great SEO writing with a strong outline.
I have found that an outline helps me organize my ideas around my target keywords. It can also give you a space to figure out the best spot to include the features that make a blog post great like:
- Videos.
- Statistics.
- Quotes.
- Internal and external links.
Outlining is an important creative step where you decide the angle and goal of your blog post.
You already have a great post title, so your next step is to outline how your post will cover the topic. You can create a detailed outline or a quick overview, whichever is best for you.
Pro tip: An outline is a great space to write each of your headers. Writing these during your outline can make the process of drafting your blog go more smoothly.
6 Free Blog Post Templates
Save time creating blog posts with these free templates.
- "How-to" Post
- "What is" Post
- Listicle Post
- And More!
Download Free
All fields are required.
4. Use keywords strategically throughout the blog post.
Now, it’s time to incorporate your keywords into your blog post. But where is the best place to include these terms so you rank high in search results?
There are two more essential places where you should try to include your keywords: headers & body and URL.
Headers & Body
Mention your keyword at a normal cadence throughout the body of your post and in the headers.
That means including your keywords in your copy, but only in a natural, reader-friendly way. Don’t go overboard at the risk of being penalized for keyword stuffing.
Before you start writing a new blog post, you’ll think about how to incorporate your keywords into your headers and post. That’s a smart idea, but it shouldn’t be your only focus, nor even your primary focus.
My biggest piece of advice is that, whenever you create content, your primary focus should be on what matters to your audience, not how many times you can include a keyword or keyword phrase in that content.
Focus on being helpful and answering whatever question your customer might've asked to arrive on your post. Do that, and you’ll naturally optimize for important keywords, anyway.
URL
Search engines also look at your URL to figure out what your post is about, and it’s one of the first things it’ll crawl on a page.
You have a huge opportunity to optimize your URLs on every post you publish, as every post lives on its unique URL — so make sure you include your one to two keywords in it.
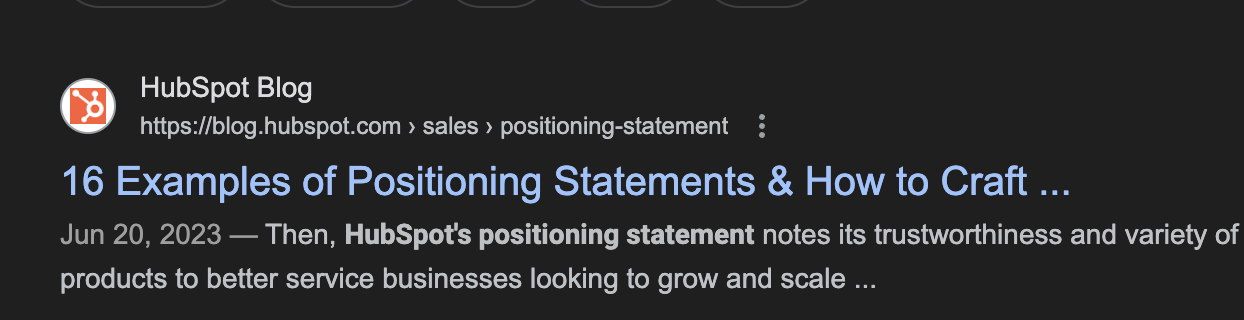
In the example below, we created the URL using the keyword “positioning-statement” because we want to rank for it.
Pro tip: As you write, keep in mind that your copy matters a great deal for click-through rates. This is because it should satisfy your readers’ intent — the more engaging, the better.
5. Make sure your blog post covers your topic completely.
Blog SEO is more than including focus and supporting keywords in your post. You’ll want to make each post as comprehensive as possible to make sure it answers your readers’ questions.
But what does comprehensive mean? For some, it's a matter of word count. According to HubSpot research, a blog post should be about 2,100-2,400 words long for SEO.
It's easier for longer content to rank, but not every post needs to be 2,000+ words. What’s most important is meeting your users’ needs and expectations with your post.
A few ways to create the best blogs for your audience include:
- Checking out your buyer personas.
- Research your topic on and offline.
- Talk to customers and experts about your topic.
- Stick to your topic as you write.
- Write in a consistent voice.
- Double-check facts and statistics.
Pro tip: This article is a great place to start if you want more tips on how to write a great blog post.
6. Add SEO-optimized images and videos.
Blog posts shouldn’t only contain text — they should also include images and other media that help explain and support your content.
Images make your blog posts more exciting and easy to understand. They help your readers engage, improve recall of important facts, and make your site more accessible.
Videos and GIFs are other interesting and useful additions to your blog posts. They make your content more visual, interactive, and memorable.
To use images and other media with SEO in mind, there are a few important things to remember.
File size matters. Too-large images and GIFs can slow down your page speed, which can impact ranking. It’s also important that your image dimensions are consistent for a professional look.
Choose the right kind of content for your brand voice. Funny GIFs are a great choice for some blogs, but if they don't feel right to your audience, they can have a negative impact.
Ideally, your images should make it easier to understand difficult topics or new information. This will boost your SEO and create a better on-page experience. Check out this post for more image SEO tips.
7. Include image alt text.
Search engines don't simply look for images. Rather, they look for images with image alt text.
You may be wondering why this is. Since search engines can‘t "see" images the same way humans can, an image’s alt text tells the search engine what an image is about.
This ultimately helps those images rank on the search engine's image results page.
Image alt text also makes for a better user experience (UX). It displays inside the image container when an image can't be found or displayed. Technically, alt text is an attribute that can be added to an image tag in HTML.
Here's what a complete image tag might look like:
<img class=“wt-blog__normal-image” src=“image.jpg” alt=“image-description” title=“image tooltip”>
When you incorporate image alt text, an image's name in your blog may go from something like “IMG23940” to something accurate and descriptive, such as “puppies playing in a basket.”

Image alt text should be descriptive in a helpful way — meaning, it should provide the search engine with context to index the image if it's in a blog article related to a similar topic.
To provide more context, here‘s a list of things I keep in mind when creating alt text for my blog’s images:
- Describe the image.
- Leave out “image of... ”— start with the image description instead.
- Be specific in your description.
- Keep it under 125 characters.
- Use your keywords (but avoid keyword stuffing).
Pro tip: Think about adding a Chrome extension like Arel=“noopener” target=“_blank” hrefs that allows you to quickly review alt text data for existing images. HubSpot customers can use the SEO Panel. It will recognize whether or not you have optimized your images.
8. Link to related blog posts.
You may have heard that backlinks influence how high your blog site can rank in the SERP, and that’s true — backlinks show how trustworthy your site is based on how many other relevant sites link back to yours.
But backlinks aren’t the end-all-be-all to link building. Linking to and from your own blog posts can have a positive impact on how well your blog site ranks, too.
Inbound links to your content help show search engines the validity or relevancy of your content. The same goes for linking internally to other pages on your website. If you‘ve written about a topic that’s mentioned in your blog post on another blog post, ebook, or web page, it's a best practice to link to that page.
(You might‘ve noticed that I’ve been doing that from time to time throughout this blog post when I think it's helpful for our readers.) Not only will internal linking help keep visitors on your website, but it also surfaces your other relevant and authoritative pages to search engines.
For example, if your blog is about fashion, you might cover fabrics as a topic. Adding a hyperlink from a blog post about cotton to a post about the proper way to mix fabrics can help both of those posts become more visible to readers who search these keywords.
The search engines will also have one more entry point to the post about cotton when you hyperlink it in the post about mixing fabrics. This means the post about cotton fabric, and any updates you make to it will be recognized by site crawlers faster. It could even see a boost in the SERP as a result.
There is an increasing demand for quality backlinks as confirmation of your site’s authority and reliability, but don’t forget that relevance is the key here. Backlinks from unrelated sources will have a negative influence on your website.
To put this into context, if you are a Dutch company, you cannot link to English-based sites that are irrelevant to your company. Instead, you should focus on multilingual link building, which communicates the proper viewpoint to SERPs.
HubSpot customers: The SEO Panel automatically suggests linking to other internal resources on your website.
Best for: You can think of this as solving for your SEO while also helping your visitors get more information from your content.
9. Optimize the meta description.
A meta description is additional text that appears in SERPs that lets readers know what the link is about.
The meta description gives searchers the information they need to determine whether or not your content is what they‘re looking for and ultimately helps them decide if they’ll click or not.
The maximum length of this meta description is greater than it once was — now around 300 characters — suggesting it wants to give readers more insight into what each result will give them.
So, in addition to being reader-friendly (compelling and relevant), your meta description should include the long-tail keyword for which you are trying to rank.
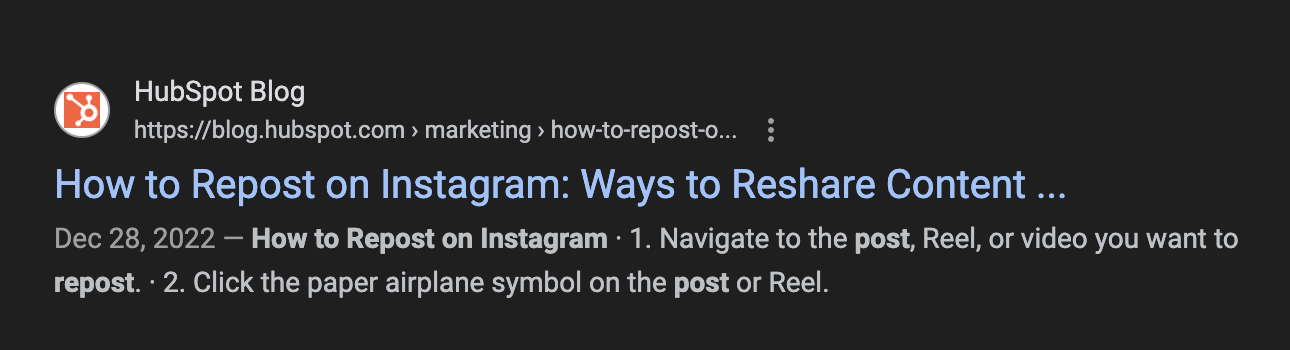
In the following example, I searched for “email newsletter examples.”
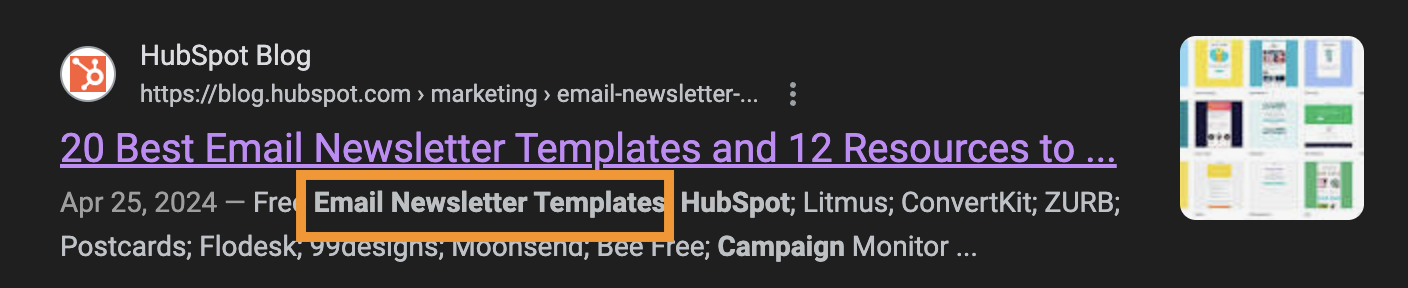
The term is bolded in the meta description, helping readers make the connection between the intent of their search term and this result.
In this example, I searched for the term “HTML space.”
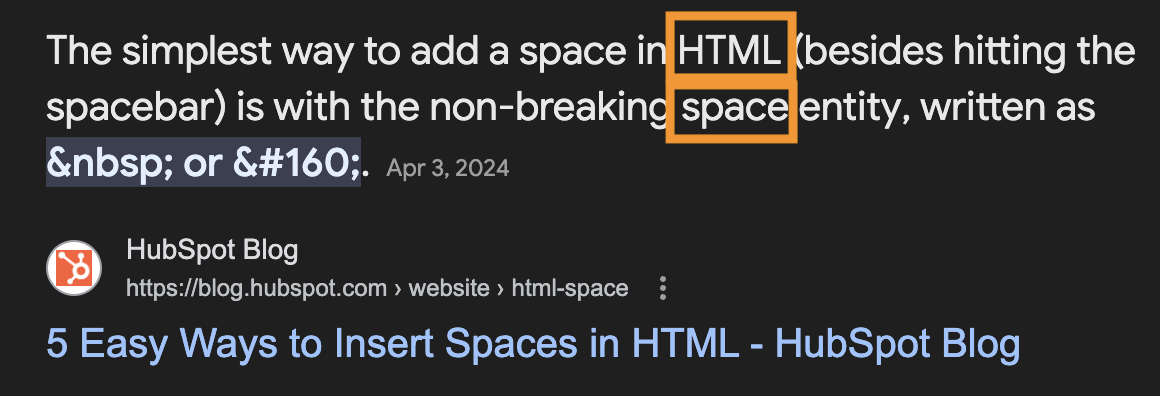
You see the terms “space” and “HTML” bolded, indicating that Google knows there's a semantic connection between “HTML space” and the words “space” and “HTML” in the meta description.
Note: Nowadays, it's not guaranteed that your meta description is always pulled into SERPs as it once was. As you can see in the above image, Google pulls in other parts of your blog post that include the keywords searched, presumably to give searchers optimal context around how the result matches their specific query.
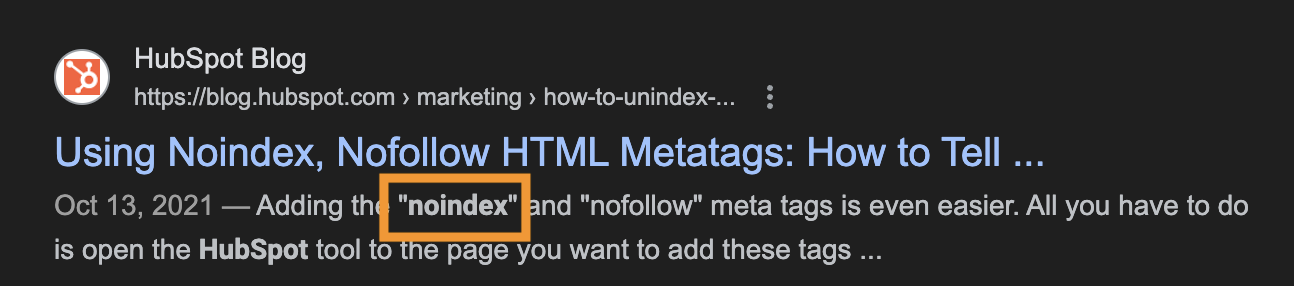
Let me show you another example. Below are two different search queries delivering two different snippets of text on Google SERPs. The first is a result of the query “no index no follow,” and it pulls in an explanation of the term “noindex”:
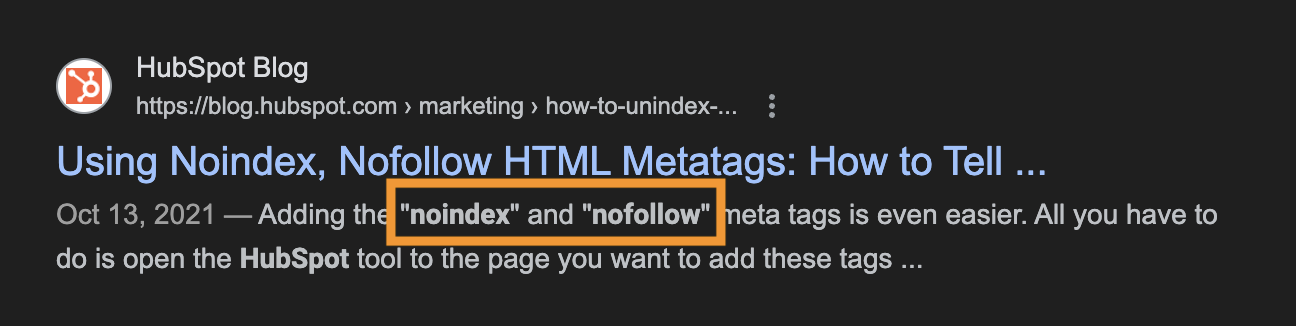
The second is a result of the query “noindex nofollow,” and pulls in the first instance of these specific keywords coming up in the body of the blog post:
While there‘s not much you can do to influence what text gets pulled in, you should continue to optimize this metadata, as well as your post, so search engines display the best content from the article.
By creating reader-friendly content with natural keyword inclusion, you’ll make it easier for Google to prove your post's relevancy in SERPs for you.
10. Review metrics regularly.
Google's free Search Console contains reports that help you understand how users search for and discover your content.
These reports help you analyze clicks from Google Search — it's useful to determine which keywords people are using to find your blog content.
You can learn how to use Google Search Console by checking out Google's performance reports page.
Pro tip: If you're interested in optimizing your best-performing older blog posts for traffic and leads like we've been doing since 2015, this tool can help you find low-hanging fruit.
Remember, many content marketers struggle with optimizing their blog posts for search. The truth is, your blog posts won't start ranking immediately. It takes time to build up search authority.
But, when you publish blog posts frequently and consistently optimize them for search while maintaining an intent-based reader experience, you'll reap the rewards in the form of traffic and leads long term.
Now, let‘s take a look at these blog SEO tips that you can take advantage of to enhance your content’s searchability.
Blog SEO Tips
- Use 1-2 long-tail keywords.
- Create SEO personas.
- Consider mobile devices.
- Make the most of the SEO tools and features in your CMS.
- Focus on readability.
- Limit topic tags.
- Create user-friendly URLs.
- Organize by topic cluster.
- Optimize for SERP features.
- Publish evergreen content.
- Update existing content.
Note: This list doesn’t cover every SEO rule under the sun. Rather, the following tips are the on-page factors to get you started with an SEO strategy for your blog.
1. Use 1-2 long-tail keywords.
Optimizing your blog posts for keywords isn’t about incorporating as many keywords into your posts as possible.
Nowadays, this actually hurts your SEO because search engines consider this keyword stuffing (as in, including keywords as much as possible with the sole purpose of ranking highly in organic search).
It also doesn‘t make for a good reader experience — a ranking factor that search engines now prioritize to ensure you’re answering the intent of your visitors.
Therefore, you should use keywords in your content in a way that doesn't feel unnatural or forced.
A good rule of thumb is to focus on one or two long-tail keywords per blog post.
While you can use more than one keyword in a single post, keep the focus of the post narrow enough to allow you to spend time optimizing for just one or two keywords.
You may be wondering: Why long-tail keywords?
These longer, often question-based keywords keep your post focused on the specific goals of your audience.
For example, the long-tail keyword “how to write a blog post” is much more impactful in terms of SEO than the short keyword “blog post.”
Website visitors searching long-tail keywords are more likely to read the whole post and then seek more information from you. In other words, they'll help you generate the right type of traffic — visitors who convert.
2. Create SEO personas.
Most businesses have buyer personas, but you can make your blog even more searchable and relevant with SEO personas.
This strategy isn’t just for boosting SEO visibility. It can help you focus your time and resources on the traffic that can boost your business.
This is a data-driven strategy that can help you understand the keyword themes and search habits of your target audience.
Once you understand these details, it will be easier to choose which topics to prioritize in your blog SEO strategy. As you create your SEO personas, you'll want to answer questions like:
- How does your target audience use social media?
- How do your ideal users respond to paid advertising?
- Do they take part in groups, forums, or message boards online?
These details can help you understand how your users search and what types of content they'll respond to online. This can help you boost traffic, leads, and conversions while also optimizing for SEO.
This presentation from Rory Hope at INBOUND 22 shares how you can use your social media data to create SEO personas for your blog.
6 Free Blog Post Templates
Save time creating blog posts with these free templates.
- "How-to" Post
- "What is" Post
- Listicle Post
- And More!
Download Free
All fields are required.
3. Consider mobile devices.
We learned earlier that more people use search engines from their mobile phones than from a computer. According to HubSpot Research, 64% of SEO marketers say that mobile optimization is an effective investment.
And for all those valuable queries on mobile devices, Google displays the mobile-friendly results first.
This is yet another example of Google heavily favoring mobile-friendly websites — which has been true ever since the company updated its algorithm in April 2015.
(HubSpot customers: Breathe easy. All content created on HubSpot's Content Hub is automatically responsive to mobile devices.)
So, how do you keep your blog mobile-friendly? By using responsive design.
Websites that are responsive to mobile allow blog pages to have just one URL instead of two — one for desktop and one for mobile, respectively.
This helps your post‘s SEO because any inbound links that come back to your site won’t be divided between the separate URLs.
As a result, you‘ll centralize the SEO power you gain from these links, helping Google more easily recognize your post’s value and rank it accordingly.
Pro tip: What search engines value is constantly changing. Be sure you're keeping on top of these changes by subscribing to Google's official blog.
4. Make the most of the SEO tools and features in your CMS.
The right CMS can help you improve blog SEO. Whether you're building a new blog post or updating site pages, the more built-in features you have, the easier it will be to optimize for SEO.
SEO is complex, so the features you'll need will depend on your level of expertise and how often you post to your blog.
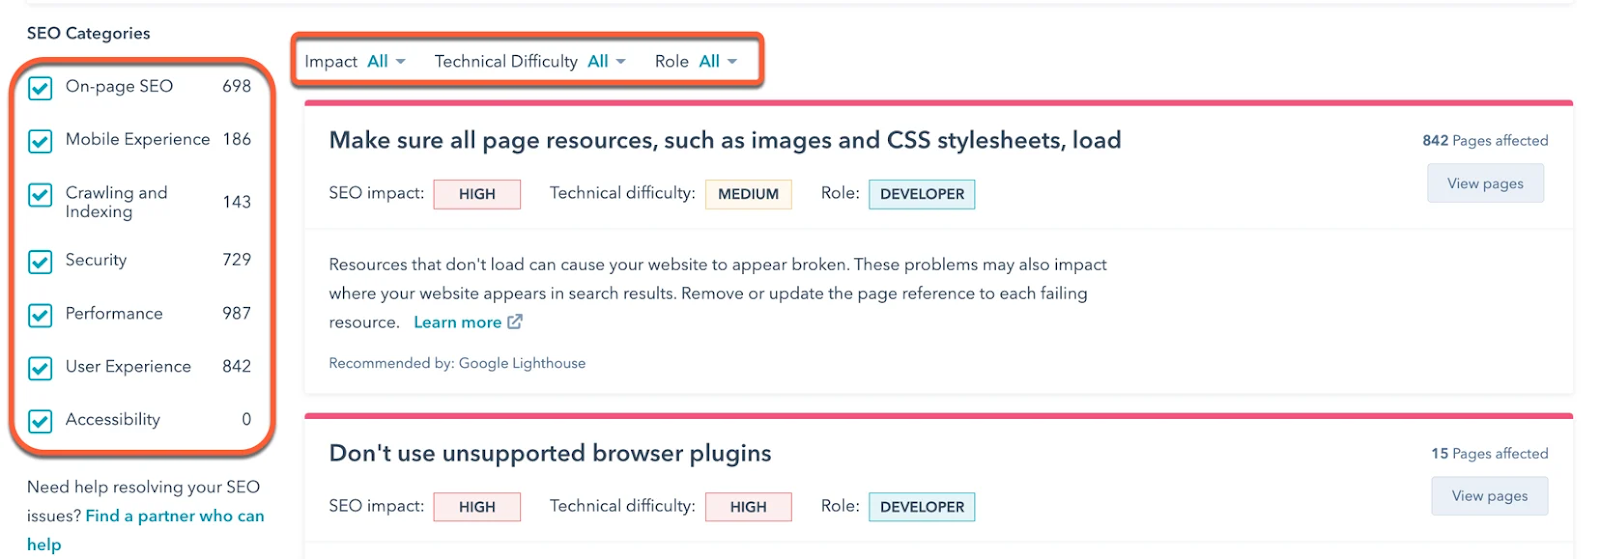
For example, the HubSpot CMS has robust SEO features that can help you build or optimize your blog. If your site already has a lot of blog posts, a tool that can scan live pages for recommendations is a must-have.
If you're just starting to blog, alt text pop-up prompts could be more useful for you.

Another challenge bloggers struggle with is finding post topics. The HubSpot SEO tool can give you suggestions with competition, popularity, and relevance in mind.
It also gives you access to monthly search keyword data. This can help you understand how specific topics can increase your organic traffic.
This tool offers detailed reports so you can track your results and update your SEO strategy quickly.
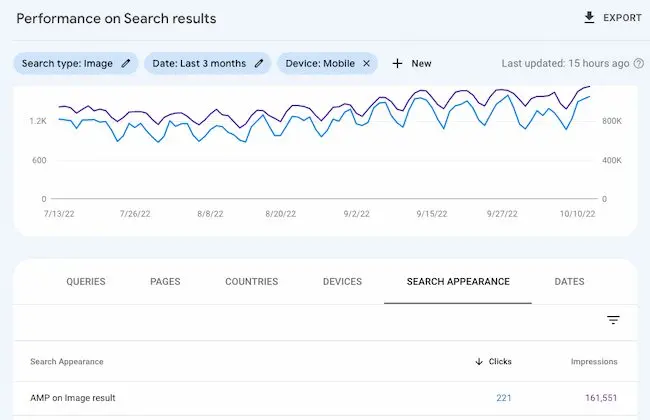
CMS integrations are also important. For example, HubSpot's page publishing tools connect to Google Search Console.
This makes it easy for you to see your top search queries, impressions, click-through rate, and more for every page on your site.
5. Focus on readability.
I’ve found one of the most common beginner blog mistakes is assuming that the people who land on your blog will read it thoroughly.
Instead, most readers are looking for a quick answer to a question. When they find your post, their goal is to find what they're looking for.
Readable content is easy to consume and quick to skim. It‘s also a delight to read — offering clear answers and a logical path from question to answer.
Readability improves the chances that your readers will engage with your content. It helps you make sure that they’ll look to your blog as an authority in your industry.
Besides improving the user experience on your blog, readability impacts SEO by making it easier for Google to crawl your posts. It also increases the potential that users will find your blog with voice searches.
There are many ways that you can improve readability. Vocabulary choices, sentence and paragraph length, and the structure of your blog posts can all make your posts more readable. A few strategies to improve readability include:
- Use short and simple words.
- Write short sentences.
- Limit jargon, adjectives, and adverbs.
Pro tip: To help you write readable copy, leverage HubSpot's Free AI Blog Writer. The tool can generate concise copy in a pinch.
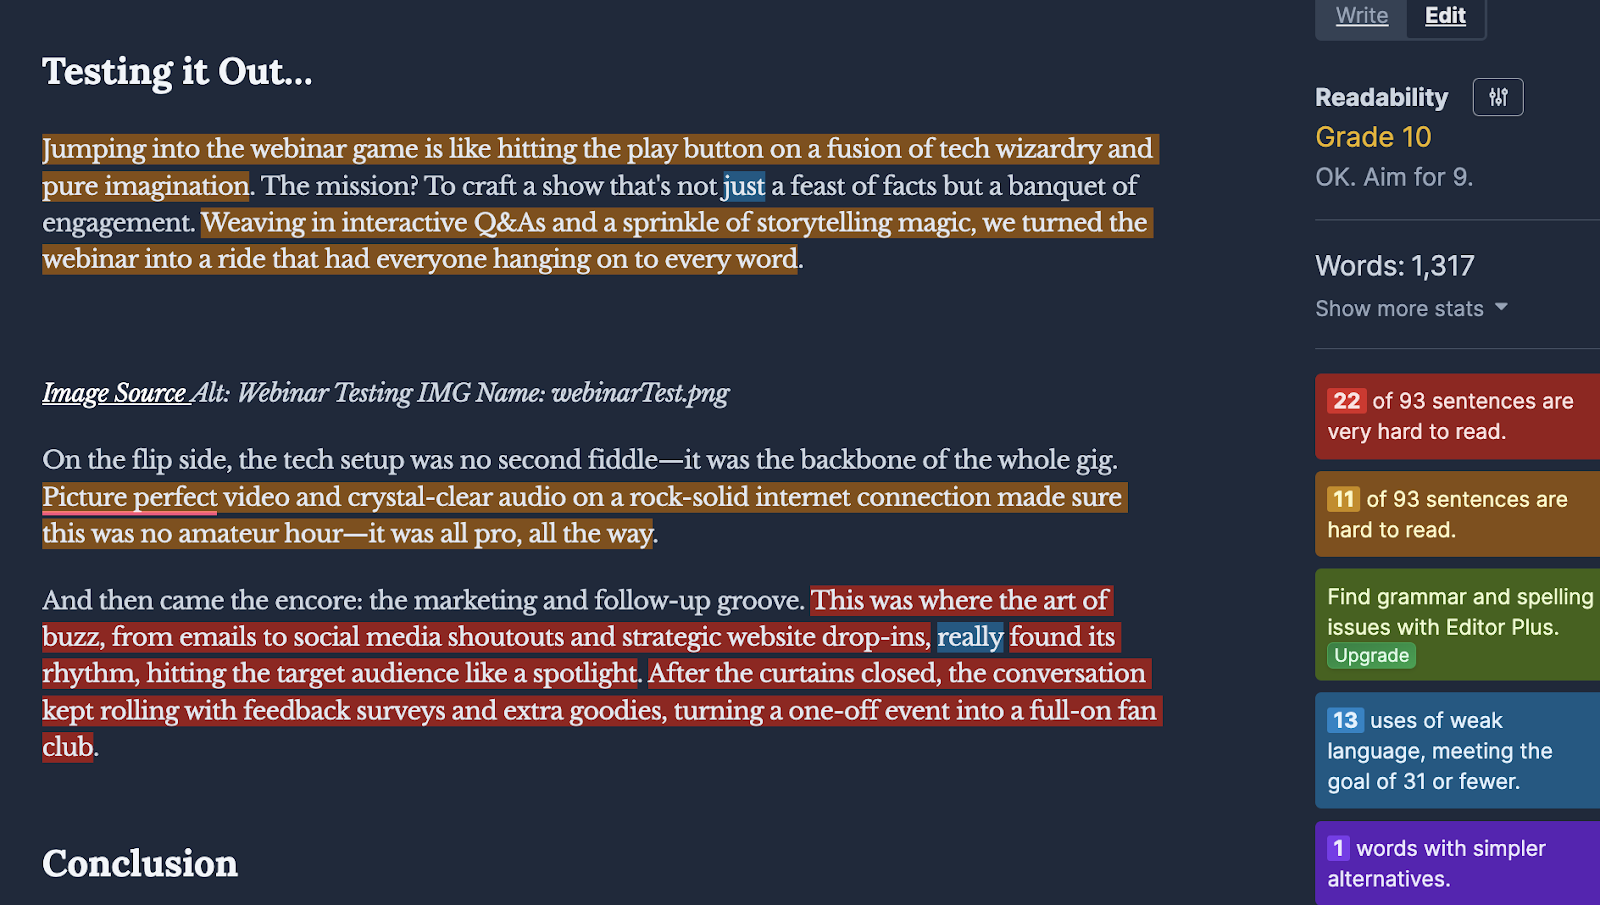
I like tools such as Hemingway Editor that offer a score that can help you understand how easy your copy is to read and how to improve it.
You can also make your blogs easier to consume by adding useful images and videos or choosing colors and fonts that are easy on the eyes.
6. Limit topic tags.
Topic tags can help organize your blog content, but if you overuse them, they can actually be harmful. If you have too many similar tags, you may get penalized by search engines for having duplicate content.
Think of it this way: when you create a topic tag (which is simple if you're a HubSpot user, as seen here), you also create a new site page where the content from those topic tags will appear.
If you use too many similar tags for the same content, it appears to search engines as if you're showing the content multiple times throughout your website.
For example, topic tags like “blogging,” “blog,” and “blog posts” are too similar to one another to be used on the same post.
If you‘re worried that your current blog posts have too many similar tags, take some time to clean them up.
Choose about 15-25 topic tags that you think are important to your blog and that aren’t too similar to one another. Then, only tag your posts with those keywords. That way, you won't have to worry about duplicate content.
Here at HubSpot, we use a Search Insights Report to map specific MSV-driven keyword ideas to a content topic each quarter.
The process helps us target a handful of posts in a set number of topics throughout the year for a systematic approach to SEO and content creation.
7. Create user-friendly URLs.
Before you publish your blog post, take a careful look at its URL structure. Is it long, filled with stop-words, or unrelated to the post’s topic? If so, you might want to rewrite it before it goes live.
The URL structure of your web pages (which are different from the specific URLs of your posts) should make it easy for your visitors to understand the structure of your website and the content they're about to see.
Search engines favor web page URLs that make it easier for them and website visitors to understand the content on the page.
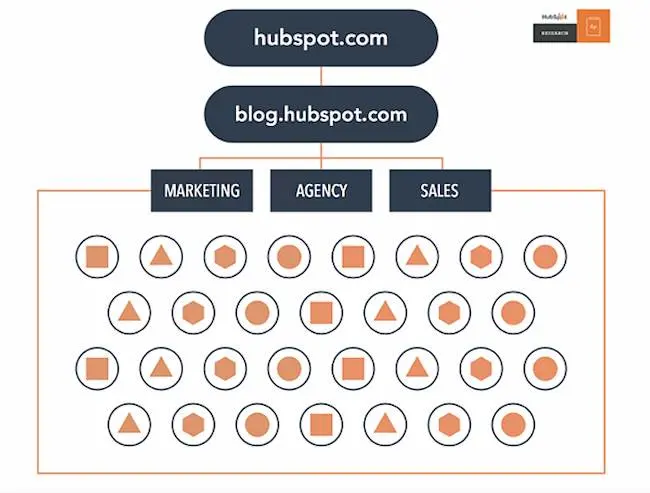
This differentiation is baked into the HubSpot blogs' respective URL structures. If I decided to go to the Marketing section from this main page, I would be taken to the URL http://blog.hubspot.com/marketing.
If we want to read the Sales section, all we have to do is change where it says “marketing” in the URL to “sales”:
http://blog.hubspot.com/sales.
This URL structure helps me understand that “/marketing” and “/sales” are smaller sections — called subdirectories — within the larger blog.
What if there‘s a specific article we want to read, such as "How to Do Keyword Research: A Beginner’s Guide"?
Its URL structure — http://blog.hubspot.com/marketing/how-to-do-keyword-research-ht — denotes that it's an article from the Marketing section of the blog.
In this way, URL structure acts as a categorization system for readers, letting them know where they are on the website and how to access new site pages.
Search engines appreciate this, as it makes it easier for them to identify exactly what information searchers will access on different parts of your blog or website.
Pro tip: Don’t change your blog post URL after it's been published — that’s the easiest way to press the metaphorical “reset” button on your SEO efforts for that post.
If your URL is less descriptive than you’d like, or it no longer follows your brand or style guidelines, your best bet is to leave it as is. Instead, change the title of the post using the guidelines we covered earlier.
8. Organize by topic cluster.
The way most blogs are currently structured (including our own blogs, until very recently), bloggers and SEOs have worked to create individual blog posts that rank for specific keywords.
This makes things unorganized and difficult for blog visitors to find the exact information they need.
It also results in your URLs competing against one another in search engine rankings when you produce multiple blog posts about similar topics.
Here's what our blog architecture used to look like using this old playbook:
Now, to rank in search and best answer the new types of queries searchers are submitting, the solution is the topic cluster model.
For this model to work, choose the broad topics for which you want to rank. Then, create content based on specific keywords related to that topic that all link to each other to establish broader search engine authority.
This is what our blog infrastructure looks like now, with the topic cluster model. Specific topics are surrounded by blog posts related to the greater topic, connected to other URLs in the cluster with hyperlinks:
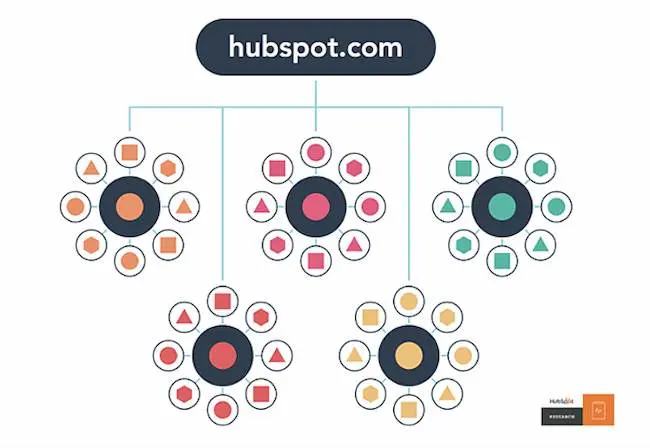
This model uses a more deliberate site architecture to organize and link URLs together to help more pages on your site rank in Google — and to help searchers find information on your site more easily.
This architecture consists of three components — pillar content, cluster content, and hyperlinks:
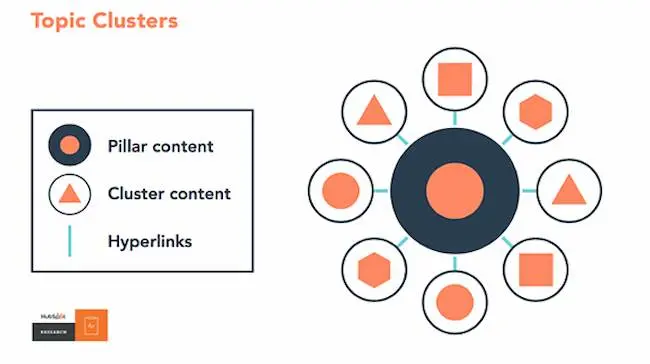
We know this is a fairly new concept, so for more details, check out our research on the topic or take our SEO training.
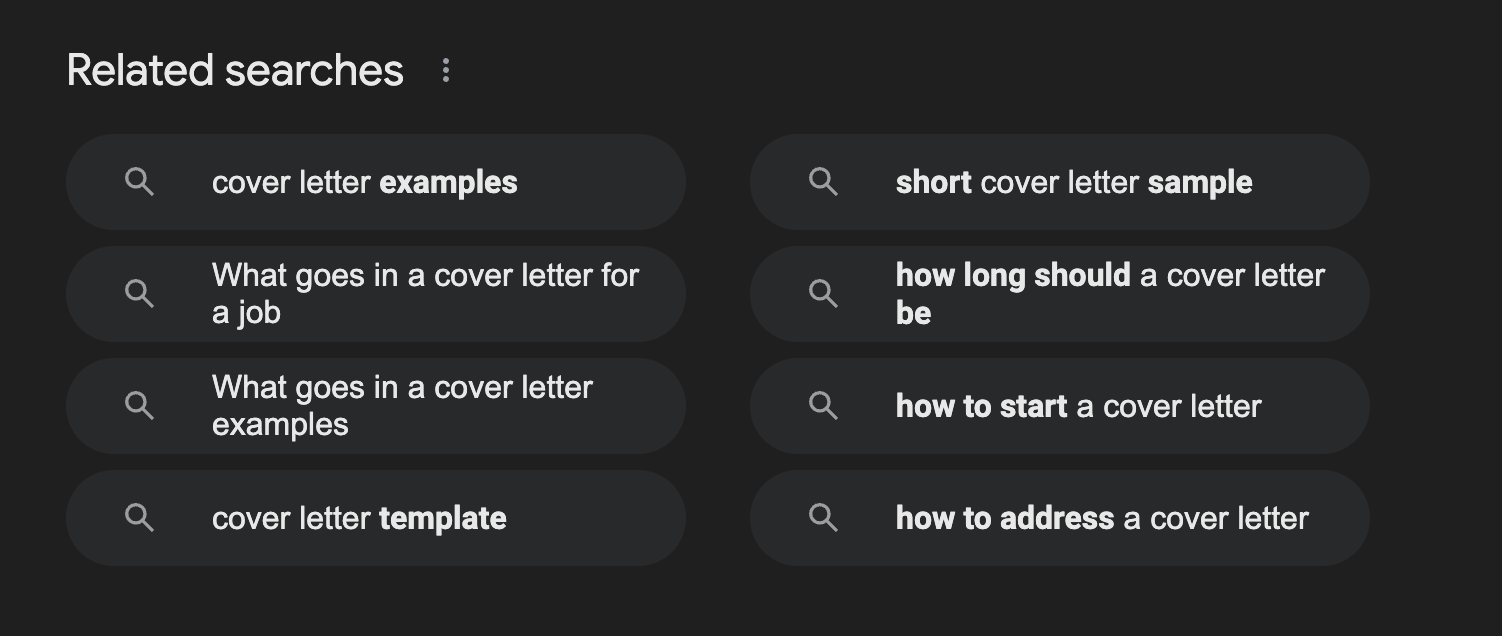
9. Optimize for SERP features.
There are more than just organic page results on Google. Instead, each SERP includes a range of different features to help users find what they‘re looking for.
For example, the related searches feature highlights questions that relate to the users’ initial search request, like in the example below:
There are many different types of SERP features. Other popular SERP features include:
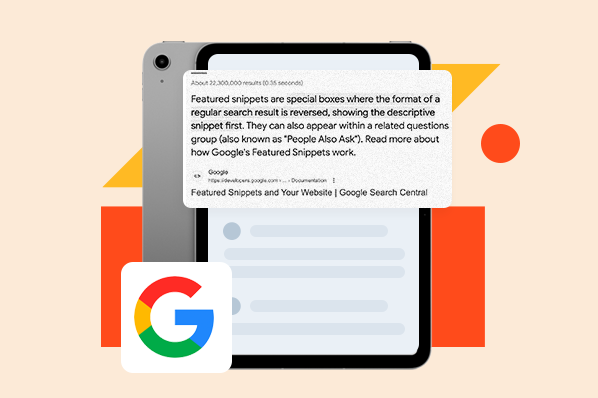
- Featured snippets. These often appear at the top of search results pages. They usually highlight a section from within a blog post to answer a specific search request.
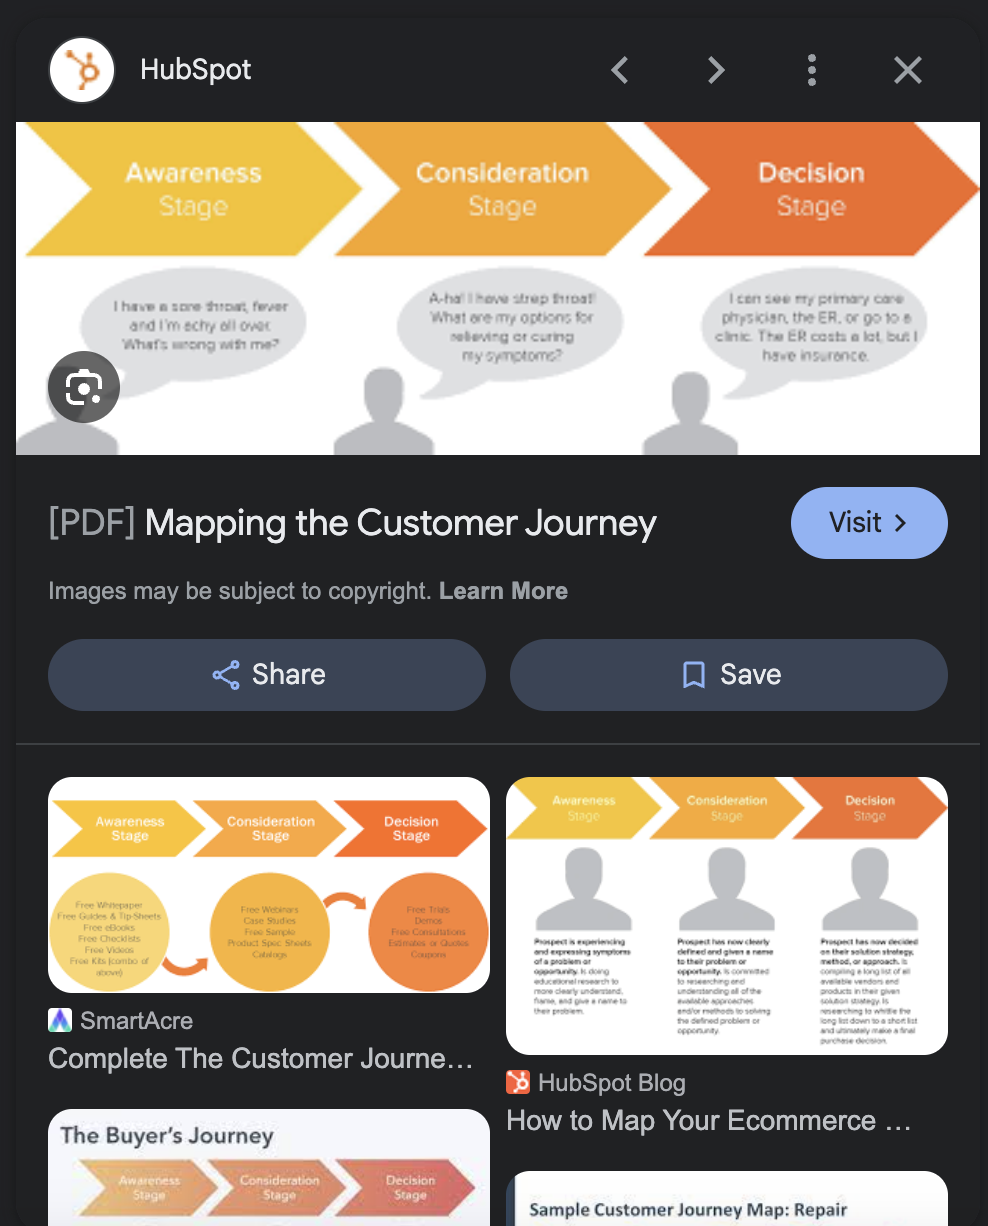
- Image packs. This is a group of images from blog posts or websites that match a search request.
- Local pack. These highlight local answers to search requests.
- Things to know. This feature usually appears on broad searches. It highlights other information that could help the user refine their search.
- Review snippets. This rich snippet is an excerpt of a specific review and may include information from a range of reviewers.
- Recipe snippets. This is a group of recipes from blog posts or websites that match a search request.
There are a few ways that you can improve your chances of getting SERP features to improve SEO for your blog.
First, write clear, well-structured, and useful content that responds to keywords in your niche. Be sure to answer specific questions within each post that relate to your blog topic.
Next, take a look at competitor examples for tips and ideas. It's also a good idea to optimize your images and videos with alt text to improve their chances of appearing for relevant searches.
Finally, learn about structured data and apply it to the formatting of your blog posts. For example, these instructions from Google outline how to format a recipe with structured data.
This HubSpot Academy lesson can help you with rich SERP results. Or listen to this podcast to learn how to win featured snippets.
10. Publish evergreen content.
When planning and writing your blog articles, make sure they are evergreen content. This means that the content is about topics that will remain relevant and valuable over a long period of time (with only minor changes or updates).
Let's look at a few reasons why evergreen content is so important:
- It'll help you rank over time, not just in the near future.
- It contributes to steady amounts of traffic coming to your blog (and website) long after it’s been published.
- It'll help you generate leads over time as a result of the traffic it continually generates.
All blog content — whether it's a long-form article, how-to guide, FAQ, tutorial, and so on — should be evergreen. Even the images you use in these posts should be evergreen.
Check out this blog post for some examples of and ideas for evergreen content on your blog.
11. Update existing content.
To improve your SEO, you may assume you need to create new blog content.
Although that's partially true, you should also focus a great deal of your time and energy on your existing blog content. Specifically, repurposing and updating your current content, as well as removing your outdated content.
This is because it takes a lot longer for a completely new piece of content to settle on the SERP and gain authority, whereas you could update a piece of content and reap the benefits fairly immediately in comparison.
Not only will your updated content rank on the SERP faster, improving your number of visitors and leads, it also takes a lot less time and fewer resources to update an existing piece of content rather than to create a brand new article.
Additionally, I’ve found that updating and repurposing some of your most successful pieces of content extends their lifespan so you can achieve the best results over a longer period of time (especially if it's evergreen content).
Get started with HubSpot's Free AI Content Writer
HubSpot's Free AI Content Writer can help you update your content by generating fresh copy. You can get the results you want by giving the tool prompts on length, tone, and reading level.
The final step entails removing outdated content that's no longer relevant to your audience. Although your goal is to ensure your content is evergreen, some of it is bound to become outdated over time.
This includes statistics, product information (if you have any listed in your blogs — as your products and business evolve), or information that changes across your industry over time.
If you want even more SEO tips, check out these resources:
Create Blog Content Your Readers (and Search Engines) Will Love
I don't expect you to incorporate each of these SEO best practices into your content strategy right away. But, as your website grows, so should your goals on search engines.
Once you figure out the goals and intent of your ideal readers, you'll be on track to deliver relevant content that will climb the ranks of the SERP.
Editor's note: This post was originally published in September 2019 and has been updated for comprehensiveness.
On-page SEO


![The Fundamentals of On-Page SEO [+How-To Checklists and Templates]](https://53.fs1.hubspotusercontent-na1.net/hubfs/53/on-page-seo-1.png)


.jpg)