.png?width=112&height=112&name=Sales%20Conversion%20and%20Close%20Rate%20Calculator%2001-300%20(1).png)

A sales activity tracker is a system that monitors progress toward sales targets using metrics and regular updates. Calendars, planners, and to-do lists help people stay on top of day-to-day work, but a sales activity tracker keeps sales teams on top of their sales activities.
![Download Now: Sales Conversion Rate Calculator [Free Template]](https://no-cache.hubspot.com/cta/default/53/059a7eef-8ad9-4bee-9c08-4dae23549a29.png)
For sales leaders, choosing the right metrics to evaluate a sales team is the starting point, and the right sales goal and activity-tracking tools make business performance easier to monitor and provide a clearer picture of what it actually takes to hit a target.
In this post, I’ll define what a sales activity tracker is, walk through how to choose the right metrics, and share my favorite tools for streamlining a sales team’s process.
Table of Contents
- What is a sales activity tracker?
- Why Tracking Sales Activity Matters
- How to Choose the Right Sales Activity Metrics
- The Three Elements of Sales Tracking
- How to Keep Track of Sales
- Sales Tracking Software Comparison
- Sales Tracking Tools (Free and Paid)
- Sales Activity Trackers: Comparison Chart
- Frequently Asked Questions About Sales Activity Tracking
What is a sales activity tracker?
A sales activity tracker is a tool that helps salespeople manage contacts, deals, and quotas more effectively. It supports sales teams in monitoring and analyzing all the moving parts of the sales process and, in turn, helps sales leaders make better, faster decisions.
The complexity of a sales team’s tracker varies with the organization’s size and budget, ranging from a simple spreadsheet to a dedicated CRM that operates seamlessly in the background. The main components, however, remain the same regardless of scope.
.png)
Free Sales Conversion Rate Template
Easily calculate drop-off rates and learn how to increase conversion and close rates.
- Dropoff and Conversion Rate Calculator
- Monthly & Quarterly Sales Goal Setting Template
- Deal and MRR Pipeline Tracker
Download Free
All fields are required.
Form not available
Why Tracking Sales Activity Matters
Tracking sales activity matters because it turns sales performance from guesswork into a measurable, repeatable process, which protects both pipeline health and rep retention. As the adage goes, “what gets measured gets improved.” A sales activity or goal tracker that connects behaviors to tangible wins keeps a pipeline healthy, and metric selection should start with the business goal and the sales motion.
Without the proper tracking processes in place, the sales department can feel like a black box where indeterminate inputs yield obscure outputs, which is a recipe for burnout. That environment also makes realistic goal-setting for managers nearly impossible.
To create a culture where sales talent wants to stick around, sales leaders need to implement unobtrusive tracking solutions in which both success and the processes that produced it are identifiable and repeatable. The primary intent of a sales goal tracker is to find actionable ways to make sales performance visible and predictable.
As the sales lead for ALINE, a web development and marketing agency, no tool proved more important for growth than the sales activity tracker. When I started, the team was disjointed, with reps using their own preferred solutions. One of my first moves was implementing HubSpot Sales Hub, along with a robust training program, to bring everyone under one umbrella.
How to Choose the Right Sales Activity Metrics
Choosing the right sales activity metrics starts with picking one primary metric — the single number that best reflects whether a team is on track — rather than tracking everything at once. When dashboards are cluttered with dozens of metrics, reps and managers alike lose the signal in the noise. Instead, start with that one number and build from there.
Choosing well means understanding the difference between leading and lagging indicators:
- Leading indicators are activity-based metrics reps can influence today, such as calls made, emails sent, demos booked, and pipeline coverage ratio. They predict future revenue and give a sales team time to course-correct.
- Lagging indicators are results-based metrics that reflect past performance, such as quota attainment, win rate, average deal size, and revenue closed. They confirm whether the strategy worked, but only after the fact.
For a real-world look at putting these metrics to work, see how Gong uses sales analytics.
The table below shows common sales KPIs and when to act on each one:
|
Metric |
Type |
When to act on it |
|
Calls made per day |
Leading |
Adjust now, before revenue dips |
|
Emails sent per week |
Leading |
Test subject lines early |
|
Demos scheduled |
Leading |
Indicator of pipeline health |
|
Pipeline coverage ratio |
Leading |
Catch shortfalls in advance |
|
Quota attainment |
Lagging |
Measure after the period closes |
|
Win rate |
Lagging |
Diagnose past deal quality |
|
Average deal size |
Lagging |
Inform future forecasting |
|
Revenue closed |
Lagging |
Ultimate success measure |
How to Pick Your Primary Metric
Picking a primary metric starts with the stage of the funnel where a sales team has the biggest gap. If the pipeline is thin, leading indicators like calls and demos booked are the place to start. If the pipeline is healthy but win rates are low, lagging indicators like deal stage conversion are more telling. Once one metric stabilizes, sales leaders can layer in a second.
Pro tip: When setting team KPIs, use HubSpot Sales Hub dashboards to visualize both leading and lagging metrics side by side. HubSpot’s guide to managing dashboards walks through setup. These dashboards give managers a real-time view of activity health and forecast confidence in one place.
The Three Elements of Sales Tracking
The three core elements of sales tracking are organizational sales goals, individual quotas, and performance benchmarks. Each one builds on the last, moving from the top-down revenue target to the daily activities required to hit it.
1. Organizational Sales Goals
Organizational sales goals are the top-down revenue targets a sales activity tracker is built to help a team hit, as outlined in a sales plan. From that top-down view, the tracker connects those goals to the activity required to reach them.
If Q3’s goal is a 10% increase in quarterly revenue from $3MM, the team needs to generate an additional $300K. By establishing a realistic average deal size, sales leaders can determine how many deals need to close to hit that target.
The C-suite will always want more. That’s why sales leaders need a tracker that can show concretely what it takes to attain those goals, whether that means adding SDR headcount, automating quoting workflows, or investing in tools to scale outbound without proportional headcount increases.
2. Individual Quotas
Individual quotas are each rep’s share of the revenue target, set in the simplest case by dividing total desired revenue by the number of reps. From there, it makes sense to account for territory differences and adhere to the general rule that 70–80% of reps should be able to meet quota; if fewer can, the goals aren’t realistic.
Measuring quota attainment is a vital component of a sales team tracker because it helps sales managers gauge performance and calculate rep compensation. It also comes with a benefit that’s often overlooked: when a few team members consistently exceed their quotas, the rest of the department takes notice.
With the right people in place, average reps will realize they need to imitate the behavior of top performers, not out of fear for their jobs but because it’s the path to unlocking accelerators and additional income. In an organization where communication and collaboration are valued, a rising tide really can raise all ships.
3. Performance Benchmarks
Performance benchmarks are the activity levels historically required to produce a given amount of revenue. Once sales managers know how much each contributor should generate, they can break those activities down and outline them using sales activity tracker templates.
Whether the sales team is made up of full-cycle reps or SDRs filling an AE’s calendar with qualified leads, the method is the same: work backward from the sales target to determine the necessary inputs.
If it takes 20 outbound calls to schedule a qualified demo and the AEs convert 20% of demos on average, then SDRs need to make 100 calls to generate a closed deal. The numbers vary, but benchmarks turn sales into a math problem. Sales activity tracker templates can also be repurposed for individual sales reps, so a rep who sees more success over email than on the phone can have their own inputs mapped to outputs.
The value of deals and the size of the sales team will inform how many dials, emails, or activities are needed per month. The activity tracker then summarizes the inputs from individual contributors, the progression of deals through the pipeline stages, and the net new business that emerges from both individual and collective effort over time.
Sales, like all professions, has both high performers and underperformers, with most reps falling close to average.
Nothing improves the performance and longevity of those in the middle of the bell curve quite like piercing the veil of “luck” and breaking down highly desirable results into actionable inputs.
That breakdown is ultimately why a sales activity tracker matters so much in any organization that’s currently flying blind. By tracking activities and the closed deals they generate, sales leaders can hone in on a formula for lasting sales success rather than winging it and hoping the numbers add up at year-end.
How to Keep Track of Sales
Keeping track of sales means logging the activities that drive revenue — prospecting, outreach, and meetings — in one tool, spreadsheet, or template so trends and needed corrections surface in one place. Sales managers can use those resources to review performance in one-on-ones and team meetings and to put a plan in place that optimizes both sales performance and team time.
Here are the key activities worth logging:
Prospecting
Prospecting can be time-consuming and sometimes frustrating, but without it, a sales pipeline is liable to dry up fast. The right sales prospecting tools can speed this up, and a sales tracker helps by logging:
- Company and decision-maker names.
- Contact details and pain points.
- Outreach activities and timestamps.
- Where and how prospects were sourced.
- Time spent per prospecting method.
After gathering a few weeks of data, patterns emerge, such as which channels convert, which don’t, and where efficiency can be gained. AI is accelerating this work. According to HubSpot’s 2025 State of Sales Report, 84% of sales professionals report using AI to optimize the sales process.
Pro tip: HubSpot Sales Hub’s prospecting tool brings lead management and prospecting activity into one AI-powered view, with daily AI-recommended actions and no tab-switching required.
Outreach
Like prospecting, cold calling is time-consuming but necessary, and tracking it offers the same potential for greater efficiency.
A sales goal tracker is the place to log:
- How and when reps reached out (call, email, in-person).
- How many prospects responded or answered.
- How many meetings were booked from outreach.
- Days and times with the highest connect rates.
After a month or so, trends surface here too, including specific days when more prospects pick up, or subject lines that drive replies, which helps a sales team optimize outreach timing and messaging.
To improve a team’s outreach hit rate, inside sales training can help; a simple lesson on using the Voice of the Customer (VoC) in prospecting, for example, can make a difference.
Pro tip: HubSpot Sales Hub’s Sales Tracking software lets sales teams monitor where each prospect is in the buyer’s journey and what stage each deal is in, giving the whole team real-time visibility.
Meetings
Meeting metrics reveal whether prospecting and outreach are actually producing conversations. A sales tracker should log them at a glance rather than leaving managers to dig through reps’ notes.
The meeting metrics to track are:
- Number of meetings held per rep, per week.
- Meeting outcomes (positive, neutral, no-show).
- Conversion rate from meeting to the next stage.
The number of meetings booked signals whether prospecting and outreach are working. The share leading to positive outcomes reveals whether the meetings themselves need improvement.
Pro tip: If prospect meetings aren’t resulting in deals, it might be time to revisit different sales closing techniques.
Free Sales Conversion Rate Template
Easily calculate drop-off rates and learn how to increase conversion and close rates.
- Dropoff and Conversion Rate Calculator
- Monthly & Quarterly Sales Goal Setting Template
- Deal and MRR Pipeline Tracker
Download Free
All fields are required.
Form not available
Sales Tracking Software Comparison
The best sales tracking tool depends on team size, budget, and the level of automation a sales team needs. The table below compares pricing and standout features across the top options, from free templates to full CRM platforms, and the write-ups that follow cover each tool in depth.
|
CRM |
HubSpot Sales Hub |
HubSpot Sales Reporting Software |
Smartsheet |
Trello |
|
Key Features |
Automated sales pipeline management, robust reporting and analytics, email inbox integration with automatic logging, deal stage tracking and bottleneck elimination, workflow automation, over 150 integrations |
Interactive visual dashboards, deal forecast reporting by stage, pipeline performance monitoring, pre-built template boards, built-in automation, over 150 integrations |
Excel-style interface, real-time sales forecasting, task visibility and consolidation, collaborative task management, enterprise-level transparency features |
Kanban-style visual boards, customizable pipeline stages, visual task and client interaction tracking, pre-built templates, built-in automation, over 150 integrations |
|
Pricing |
Free Plan: Free forever / Starter $7 / Professional $90 / Enterprise $150 per seat/month (billed annually) |
Free plan available. / Advanced features in paid Sales Hub plans (billed annually): Starter $7, Professional $90, Enterprise $150 per seat/month. |
Pro: $9/user/month (billed annually) / Business: $19/user/month / Enterprise: Custom pricing |
Free plan available (limited to 10 boards, unlimited cards) |
|
Free Trial |
Free plan available (no time limit) |
Free CRM dashboard included |
30-day free trial available |
Free plan serves as trial |
Sales Tracking Tools (Free and Paid)
- HubSpot Sales Tracking Software
- HubSpot Sales Reporting Software
- Smartsheet
- Trello
- Monday CRM
- Sales Data Tracker Template
- CRM Template
- Sales Forecasting Template
- Sales Pipeline Template
- Leads Sales Tracking Spreadsheet
Sales Tracking Software
1. HubSpot Sales Tracking Software
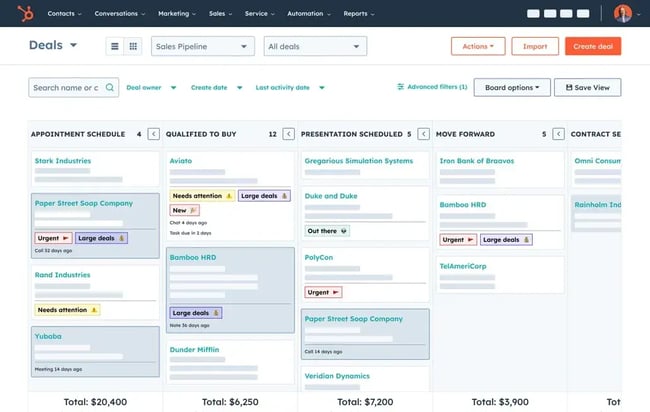
HubSpot Sales Hub is a comprehensive sales platform that centralizes deal management, contact tracking, email integration, meeting scheduling, and pipeline visualization in one workspace. For sales teams that want more than a template, its tracking software automates and streamlines the sales process as prospects move through the pipeline, with native dashboards that surface both activity metrics and revenue outcomes. The free tier provides meaningful functionality for small teams.
Get started with free sales tracking software
Key Features
- Real-time pipeline tracking shows how many deals are at each stage of the sales cycle, helping teams spot bottlenecks and close deals faster.
- Automated alerts flag stalled deals and route repetitive tasks away from reps.
- Automatic email logging records documents and communications sent to prospects directly in the HubSpot CRM.
- Custom reports give every rep visibility into their own metrics and managers a view of team performance.
- Buyer’s journey tracking shows exactly where each prospect stands, so deals don’t slip.
Best for: Sales teams of any size that want a unified platform connecting activity tracking, pipeline management, forecasting, and reporting.
Pricing: Free plan available; paid Sales Hub tiers run Starter $7, Professional $90, Enterprise $150 per seat/month (billed annually).
What I like: Being able to see how much of the pipeline is caught up in each stage at any moment is what makes the difference for me. It turns “are we on track?” from a gut feeling into something I can actually look at and act on.
2. HubSpot Sales Reporting Software
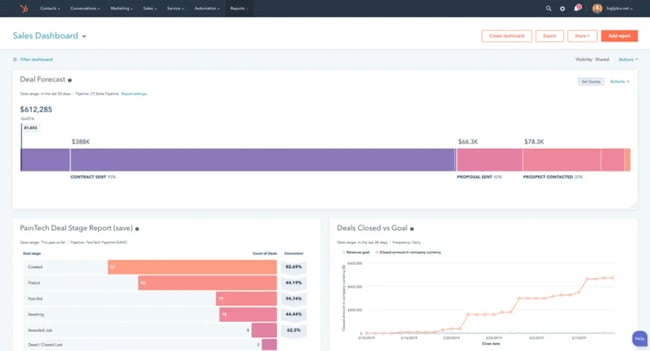
HubSpot’s sales reporting software provides sales teams with interactive dashboards that track pipeline, activity, and revenue, using data pulled directly from HubSpot CRM and Sales Hub. Managers can build reports around whichever metrics matter most and manage the underlying data for transparent deal forecasting, all without exporting to a spreadsheet. For a starting point, HubSpot outlines the essential sales reports for sales leaders.
Key Features
- Deal forecast reporting shows the amount of forecasted revenue by deal stage.
- Pre-built template boards let sales leaders set up pipeline dashboards without having to build from scratch.
- Built-in automation handles repetitive reporting tasks so reps spend less time compiling data.
- Customizable dashboard views include Gantt, Kanban, and more.
- Over 150 integrations connect the tool to the rest of a sales team’s stack.
Best for: Sales teams that want visual deal forecasting and reporting built on live CRM data.
Pricing: Included with the free HubSpot CRM; advanced reporting features come with paid Sales Hub plans (Starter $7, Professional $90, Enterprise $150 per seat/month, billed annually).
What I like: Staying on track with my goals is easier and more motivating when I can see how I’m doing. The charts give me a visual read on my performance and let me quickly regroup if I’m falling behind.
3. Smartsheet
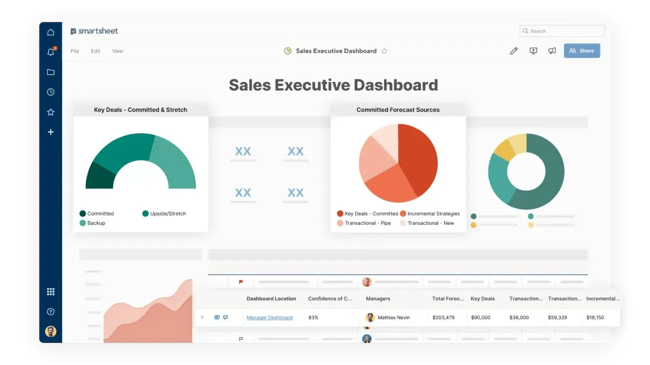
Smartsheet is a work management platform with sales tracking capabilities built on a familiar spreadsheet-style interface. It’s designed to provide greater visibility and consolidation of a team’s work, making it useful for large sales teams where transparency and accountability matter. For anyone who has tracked sales goals and data in Excel but is ready for a more comprehensive solution, the switch doesn’t mean learning a completely foreign landscape.
Key Features
- Real-time sales forecasting and task visibility keep the pipeline status up to date.
- An Excel-style interface gets spreadsheet users productive right away.
- Collaborative task management lets teams track sales goals simultaneously.
Pricing: Free plan available; paid tiers run Pro $9 and Business $19 per user/month (billed annually), with custom Enterprise pricing.
Best for: Enterprise-level sales leaders and executives who want more visibility and alignment with sales rep activities.
What I like: What caught my eye first was how much it feels like a spreadsheet. If you’ve spent years living in Excel, Smartsheet lets you upgrade to something more powerful without abandoning the layout your brain already knows, and that lowers the barrier to actually adopting it.
4. Trello
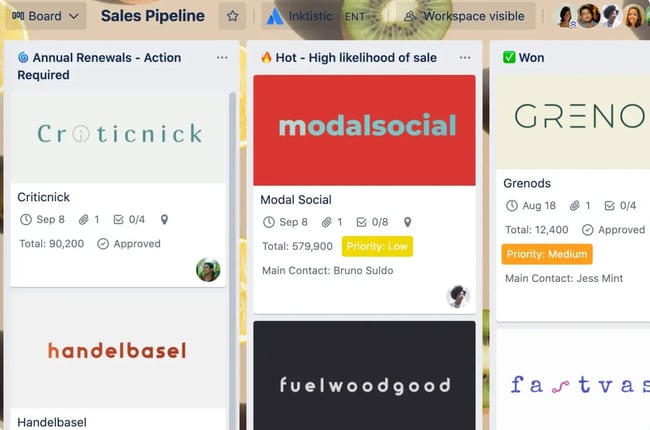
Trello is a Kanban-style project management tool that sales leaders can customize to a sales team’s needs, using visual boards to track outreach and pipeline stages. The free plan suits individuals or small teams working on fewer deals at once; it caps a workspace at 10 boards but allows unlimited cards, enough to map pipeline stages to boards and individual tasks or client interactions to cards.
I personally find that it works great for tracking my sales outreach with clients. The Kanban-style board makes it easy to visualize outreach and stay on top of sales goals.
Key Features
- Kanban boards give a visual overview of the full pipeline, including tasks and their status at each stage.
- Pre-built template boards and built-in automation make it quick to get started.
- Over 150 integrations connect Trello to other sales pipeline and goal-tracking tools.
Best for: Small teams looking for a visual pipeline dashboard.
Pricing: Free plan available (10 boards, unlimited cards); paid tiers run Standard $5, Premium $10, Enterprise $17.50 per user/month (billed annually).
What I like: Trello works great for tracking sales outreach with clients. The Kanban board makes it easy to see the whole pipeline at a glance and stay on top of sales goals, and for a small volume of leads that visual simplicity beats a heavier CRM.
5. Monday CRM
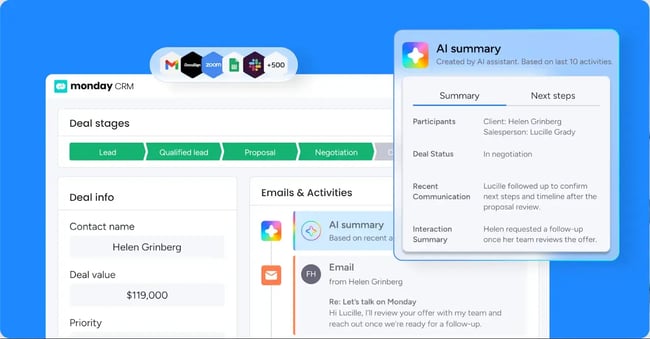
Monday.com’s sales CRM brings the platform’s signature visual workflow boards to sales pipeline management. Sales teams can customize stages, automate routine notifications, and track deals through a drag-and-drop interface that feels more like a project management tool than a traditional CRM.
Key Features
- Customizable board views organize deals and tasks the way a sales team works.
- Automations handle routine notifications and status changes.
- A visual, spreadsheet-style layout makes large amounts of pipeline data easy to scan.
Best for: Small sales teams that want a visual, board-based CRM and are ready to commit to at least three seats.
Pricing: Free plan available (up to 2 users); paid Sales CRM tiers run Basic $12, Standard $17, Pro $28 per seat/month (billed annually), with custom Ultimate pricing. All paid plans have a 3-seat minimum.
What I like: Monday’s boards are a more visual version of a spreadsheet, which is great for anyone whose eyes glaze over staring at cells and numbers for too long. That visual organization makes it easy to stay on top of a sales workflow without feeling buried in data.
Sales Tracking Templates
6. Sales Data Tracker Template
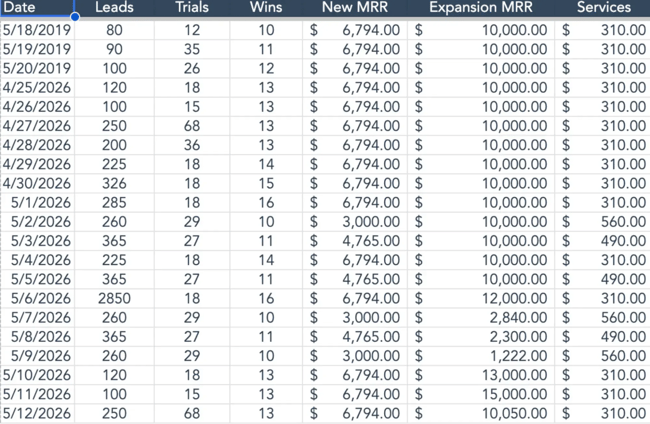
A sales data tracker template is a simple, effective way to build a sales dashboard in a spreadsheet. With it, sales managers can help their team track and manage outreach activities and performance without investing in dedicated software.
I personally love a good spreadsheet. You can do incredible things in Excel, and there have never been more resources available to help you master this value-packed software. I also love a free template, so this sales dashboard is a win–win.
Key Features
- Offers snapshots of key sales objectives and metrics for more accurate performance tracking.
- Includes step-by-step instructions for each section.
- Works in both Excel and Google Sheets.
Best for: Teams that want sales tracking that integrates with a spreadsheet workflow they already use.
Pricing: Free to download.
What I like: I love a good spreadsheet — you can do incredible things in Excel, and there have never been more resources to help you master it. A free template that turns that into a ready-made sales dashboard is a genuine win.
7. CRM Template
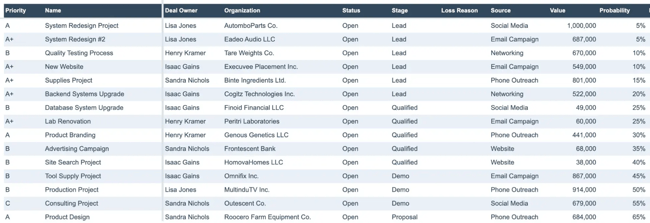
HubSpot’s free CRM template is a sales lead follow-up tracker for small teams interested in a CRM but not ready to commit to full client management software. It gives sales teams a place to record how they interact with customers, with fields for meeting notes, names, titles, and proposed solutions to discuss on the next call.
Key Features
- Displays the sales pipeline and the value of open opportunities for better relationship management.
- Calculates the team’s win/loss ratio based on the progress of each entered opportunity.
- Helps salespeople organize, track, and rank prospects by priority.
Best for: Small teams looking for an introduction to sales tracking.
Pricing: Free to download.
What I like: It’s a low-commitment way to see whether a structured CRM fits how a team already works, before paying for one.
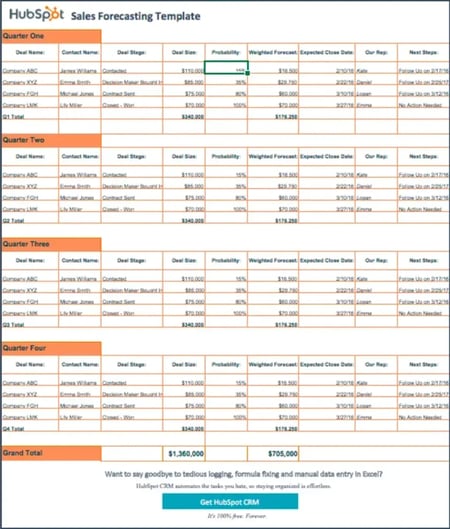
8. Sales Forecasting Template
A sales forecasting template makes the sales forecasting process easier to understand for people who aren’t familiar with it. This one lets teams see the stage each deal is in to help calculate the probability of a successful close, and it comes bundled with other sales templates and checklists in a sales productivity kit.
Key Features
- Divides sales progress into quarterly increments to predict closing rates better.
- Makes data simple to input and interpret in a single sheet.
- Comes with a broader sales productivity bundle of templates and checklists.
Best for: Bootstrapped startups, entrepreneurs, and reps who are just getting started without a suite of complex tools.
Pricing: Free to download.
What I like: Knowing typical close rates by stage is what keeps a funnel from running empty, and this template makes that math approachable for someone forecasting for the first time.
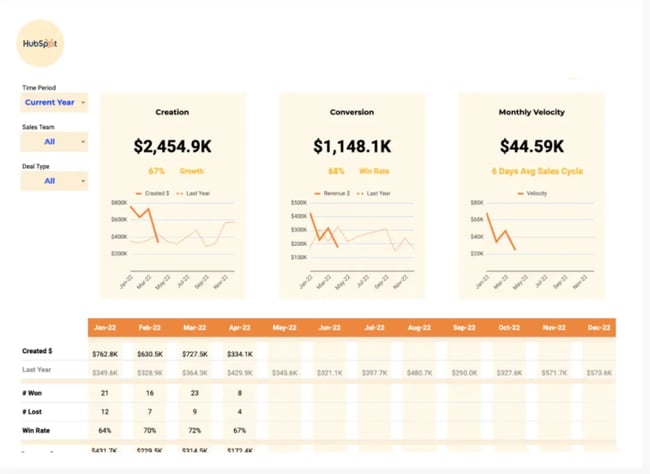
9. Sales Pipeline Template
A sales pipeline template gives stakeholders a macro view of what’s moving through the sales pipeline. This tracking spreadsheet breaks down the number of deals in each stage so sales leaders can visualize the progress and opportunities within the team.
Key Features
- Provides a probability-percentage average of prospects reaching each step.
- Includes visual bar graphs that flag which pipeline stages need improvement.
- Works as a simple tracker to evaluate the overall sales strategy.
Best for: High-level sales pipeline analysis for managers, board members, and other executives and stakeholders.
Pricing: Free to download.
What I like: Breaking the pipeline down by stage makes it easy to see at a glance where deals stall and where the real opportunities are.
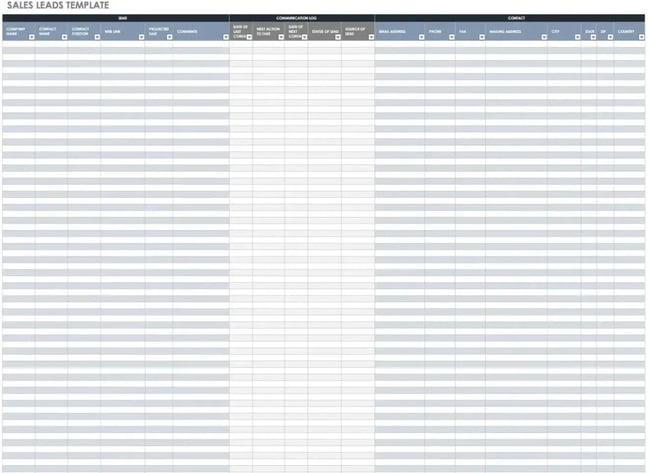
10. Leads Sales Tracking Spreadsheet
A lead sales tracking spreadsheet gives sales teams an organized view of lead data without a full CRM. Entering data is quick with a detailed lead tracker, and it works as a bridge solution for a team that isn’t ready to invest in a dedicated platform yet.
Key Features
- Tracks communications with each customer and plans future follow-ups as prospects progress.
- Lets teams record lead sources to identify how prospects found the business.
- Exports to CSV to carry historical data into a full CRM when the team is ready.
Best for: Small businesses and entrepreneurs in the early stages of lead generation.
Pricing: Free to download.
What I like: It’s a solid bridge between spreadsheets and a real CRM — you keep an organized view of your leads now, and the data comes with you when you outgrow it.
Free Sales Conversion Rate Template
Easily calculate drop-off rates and learn how to increase conversion and close rates.
- Dropoff and Conversion Rate Calculator
- Monthly & Quarterly Sales Goal Setting Template
- Deal and MRR Pipeline Tracker
Download Free
All fields are required.
Form not available
Sales Activity Trackers: Comparison Chart
Use the table below to shortlist tools based on a team’s size, budget, and tech maturity. Team size is a good starting point.
- Early-stage (1–5 reps): A free template or the free HubSpot CRM to start, with room to scale up as the pipeline grows.
- Growth-stage (5–50 reps): HubSpot Sales Hub or Monday CRM for pipeline management with automation.
- Enterprise (50+ reps): HubSpot Sales Hub Professional or Enterprise for advanced forecasting and customization.
|
SOFTWARE |
FEATURES |
PRICE |
|
HubSpot Sales Tracking Software |
|
|
|
HubSpot Sales Reporting Software |
|
|
|
Smartsheet |
|
|
|
Trello |
|
|
|
Monday CRM |
|
|
|
Sales Data Tracker Template |
|
Free to download. |
|
CRM Template |
|
Free to download. |
|
Sales Forecasting Template |
|
Free to download. |
|
Sales Pipeline Template |
|
Free to download. |
|
Leads Sales Tracking Spreadsheet |
|
Free to download. |
Frequently Asked Questions About Sales Activity Tracking
What are SMART goals for sales?
SMART goals for sales are targets that are Specific, Measurable, Achievable, Relevant, and Time-bound. Applying the framework turns vague aspirations into targets reps and sales managers can track and course-correct against. Sales goal tracker setup begins with setting a SMART goal.
A SMART sales goal in practice: “Our outbound SDR team will book 60 qualified demos in Q3 by making at least 50 calls per rep per day, targeting mid-market SaaS companies with 50–200 employees, measured weekly in HubSpot Sales Hub.” That single goal is specific (60 demos), measurable (tracked weekly), achievable (grounded in current capacity), relevant (it feeds pipeline), and time-bound (a Q3 deadline).
How do you measure sales goals effectively?
Measuring sales goals effectively means pairing the right KPIs with the right review cadence. The most successful sales organizations use both leading and lagging indicators: leading metrics steer daily behavior, while lagging metrics evaluate period-over-period outcomes.
Working backward from the revenue goal shows how. To close $500K in a quarter at a $25K average deal size, a team needs 20 closed deals — which at a 25% win rate means 80 qualified opportunities, roughly 267 demos, and about 1,335 discovery calls (around 103 per week across the team). Monitored weekly in sales tracking software, that leading-indicator math flags whether a team is on pace within days, not at quarter’s end when it’s too late.
What are the 5 P’s of goal-setting?
The 5 P’s of goal-setting are Purpose, Picture, Plan, People, and Process — a framework for building goals that stick, which matters in sales, where clarity drives rep adoption.
- Purpose: Why the goal matters. Connect individual quotas to team and company outcomes.
- Picture: What success looks like. Define the specific result (e.g., $2M closed-won in Q4).
- Plan: The step-by-step activities required. This is where SMART goals and benchmarks live.
- People: Who is responsible for what? Assign ownership at the individual and team level.
- Process: How progress is tracked and reviewed. Set up weekly deal reviews, bi-weekly 1:1s, and monthly pipeline calls.
The framework only delivers value when paired with consistent tracking and review. Sales tracking software can automate progress reports and schedule recurring pipeline reviews so the 5 P’s stay active all quarter — and tracker adoption improves when the tracker is simple and updated on a consistent cadence.
Make Smart Decisions With a Sales Activity Tracker
A sales activity tracker’s real value lies in the full picture it provides of a sales team’s productivity, broken down into close rates, projected revenue, and individual contributors’ performance. Tracking those numbers closely is what makes faster, better-informed decisions possible.
Whether you’re a sales rep, a sales manager, or an executive, the information you need to do your best work lives in a sales activity tracker — I’ve yet to find a role it doesn’t help.
Editor’s note: This post was originally published in September 2020 and has been updated for comprehensiveness.
Free Sales Conversion Rate Template
Easily calculate drop-off rates and learn how to increase conversion and close rates.
- Dropoff and Conversion Rate Calculator
- Monthly & Quarterly Sales Goal Setting Template
- Deal and MRR Pipeline Tracker
Download Free
All fields are required.
Form not available
![Modern sales orgs are leaning into marketing behaviors — here's what that means for you [new data]](https://53.fs1.hubspotusercontent-na1.net/hubfs/53/sales-team-marketing-behaviors-1-20251117-5976195.webp)
![Why your sales enablement content needs real-world credibility [new data]](https://53.fs1.hubspotusercontent-na1.net/hubfs/53/sales-enablement-content-credibility-1-20251028-1482008.webp)


.webp)

.png)