One thing I’ve learned is that an individual website metric is not enough on its own. I always look at metrics in combination with each other to get a full performance picture. Plus, context on the brand, target audience, and business goals is essential. Otherwise, I’m just looking at numbers on a page rather than getting meaningful insights.
All that starts with understanding fully which metrics to track and what they really mean. Let’s get into it.
Table of Contents
- Website Engagement Metrics
- What are website engagement metrics?
- How Website Metrics Can Help You Grow Your Website [+ Data]
- How to Improve Website Engagement Metrics
HubSpot Marketing Analytics Software
Measure the performance of all your marketing campaigns in one place with built-in analytics, reports, and dashboards.
- Marketing Analytics
- Dashboard Software
- Website KPIs
- And More!
What are website engagement metrics?
Website engagement metrics are data points that represent how users are interacting with your website. They refer to any interaction users have with the website, whether it’s how long they stayed on a page, how deeply they scrolled, or the buttons they clicked. Analyzing these metrics will help you understand what adjustments to make to your site, from design choices to refining the user journey.
The purpose of a website is to attract visitors and convert them into leads or customers. Website engagement metrics are there to help you understand if that’s happening, how to improve the frequency at which it’s happening, and which elements of your site are helping (or not helping) you reach those goals.
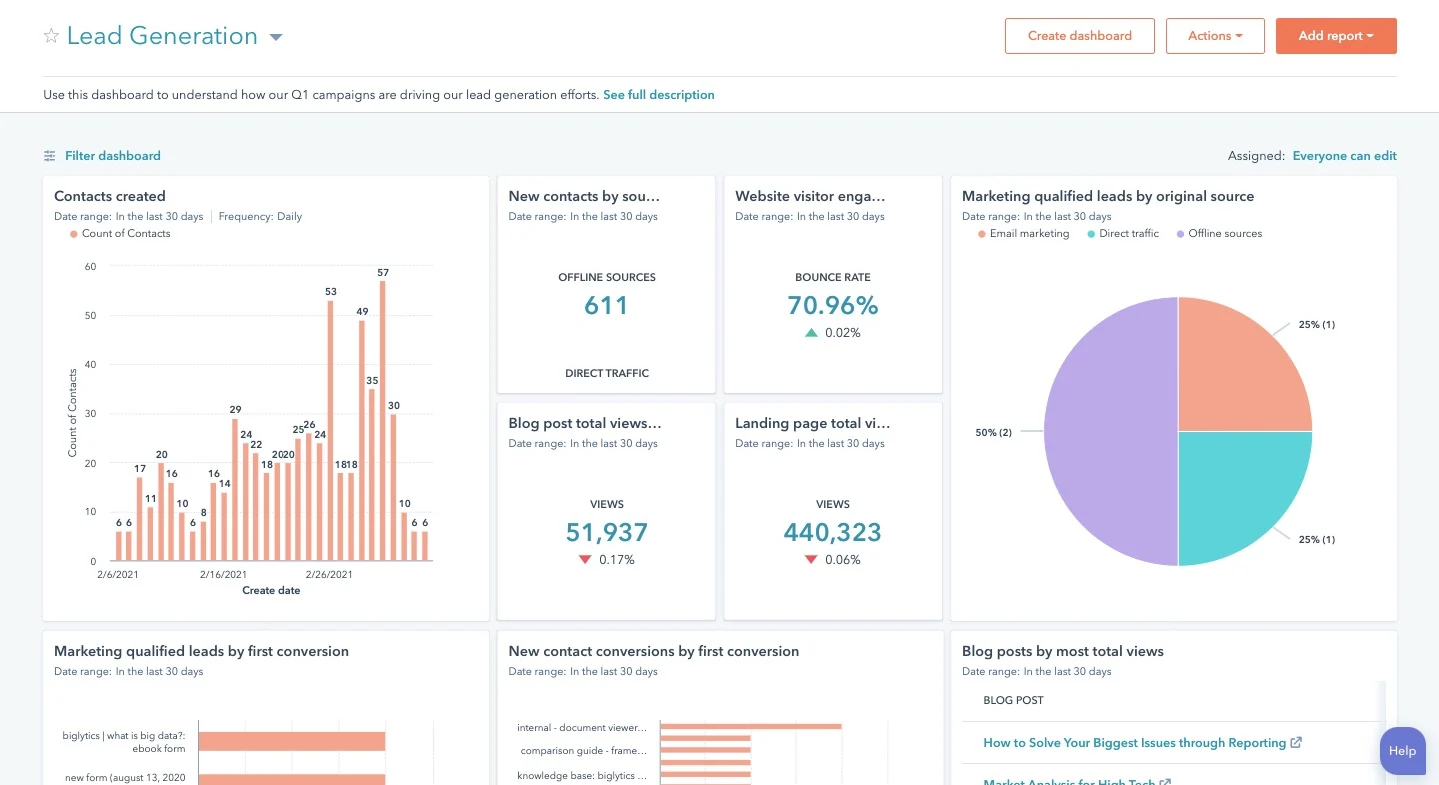
I use analytics tools like HubSpot or Google Analytics to see engagement metrics and figure out where a site is capturing attention and how to improve overall engagement.
Here's a glimpse of HubSpot's analytics tool and how it breaks down complex website data into a user-friendly format:
Before I get into individual metrics to track, I want to note that website metrics can vary from one platform to another. There are some “standard” metrics that most platforms track, but they might be named differently. For example, GA4’s “conversions” became relabeled as “key events.” So be sure to check definitions depending on which platform you’re using.
I’m going to break down these metrics by their more generic terms, but just be aware you might see slightly different terminology depending on where you’re looking.
Website Engagement Metrics
- Views
- Average Time on Page
- Average Session Duration
- Views per User/Pages per Session
- Engagement Rate/Bounce Rate
- Traffic Sources
- Social Referrals
- New Visitor Sessions/New Users
- Returning Visitor Sessions
- Device Type
- Conversion Rate
- Exit Rate
- Top Pages
- Top Exit Pages
- Revenue Attribution
- Event Tracking
There are lots of terms and buzzwords out there when it comes to marketing metrics. So let’s break down the best website engagement metrics and why I think it’s worthwhile to track them.
1. Views
Views measure the number of times a page on your website is seen by a user. It’s also known as page views. A page view is triggered every time an individual webpage loads in a browser. If someone refreshed the page and reloaded it, this would count as two page views.
A quick note here as I often have to explain this to clients: Views are not the same as sessions. Views refer to an individual page loading. They can be aggregated into an overall views metric for the site, but it’s still a page-by-page metric. Sessions, on the other hand, refer to the entire chunk of time the user spent on your site. So one “session” could have nine “views” if a user visited nine different pages.
Web traffic is among the top two most common content marketing measurements of success. But I will say, it’s not that useful on its own. I recommend tracking this over time to ensure an upward trend.
2. Average Time on Page
Average time on page refers to how long users spend on a page of your website on average.
Let’s say I have a detailed blog post, for example. I’d like to see a high average time on page because it’s an indication that visitors are staying long enough to read the content. And I would expect this to be higher than on shorter pages that serve a different purpose, like a product page or a webinar sign-up page.
HubSpot’s State of Marketing report found that, instead of a focus on scaling traffic in 2025, marketers are focused on scaling attention. Time on page is an excellent indicator of attention.
It’s also a good way to tell if I’m getting the right users to a website. If I’m confident that the content is good quality, people who are within my target audience should want to hang around. So a low average time on page could indicate a mismatch between the brand and the audience finding the site.
Pro tip: This metric is now called average engagement time per session on GA4 — which I like because it covers not just how long someone sat on your web page, but how long they were actually paying attention and interacting.
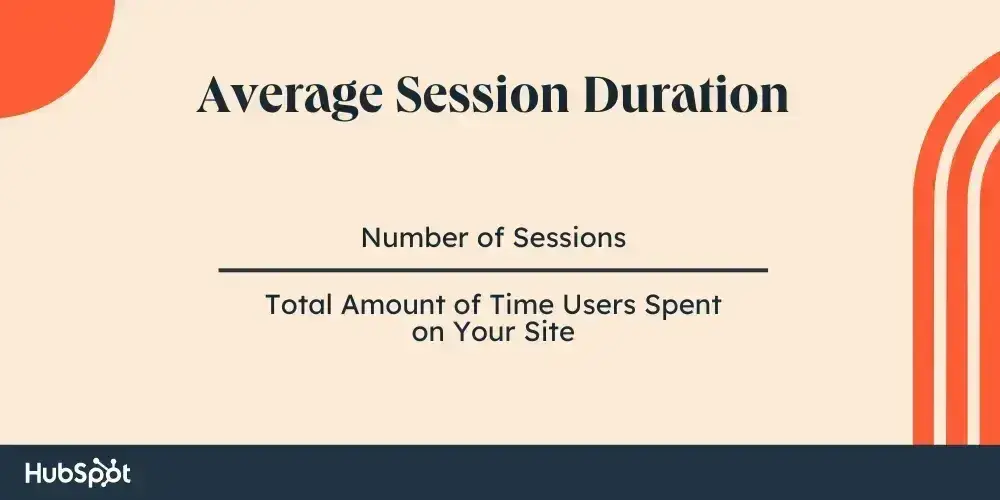
3. Average Session Duration
Average session duration is how long users are spending on your site in total for their visit.
Regardless of how many pages they clicked, this is how long they’re spending on your website. It’s a good high-level metric that I like to check out, especially if I’ve recently made some big changes to a site.
Pro tip: Average session duration, like many other metrics, can vary massively from one industry to another. A low score for a restaurant website, for example, is not necessarily a bad thing. It could actually be an indication that your site is well designed and users are finding the information they need quickly and efficiently. But that would be a very different story for a content-heavy site like a news publication.
4. Views per User/Pages per Session
Views per user (which was previously pages per session on Google Analytics) shows how many pages the average user visits within a single session.
Why is this important for engagement? I always tell people it’s like someone walking past your shopfront and admiring things in the window display, but not coming inside to check them out. When users click through multiple pages on a website, it shows they’re engaged with your content. These users are more likely to become subscribers or purchase a product.
Again, context is important here and I always look at this in combination with another metric like average session duration.
5. Engagement Rate/Bounce Rate
Bounce rate measures the percentage of visitors who load one page on your website, then leave without interacting with the page or visiting any other pages.
For me, bounce rate is important because it can indicate two things:
- Something about the design, page layout, or copy is driving people away without them wanting to interact.
- An irrelevant audience is finding the website, and they clicked onto it in the first place because they thought it was something else.
Both of these are big issues to solve, so I’ll always look at bounce rate with other engagement data points to get to the root cause.
If you’re in GA4, you’ll notice bounce rate has been flipped to a new metric called engagement rate. According to Google:
“An engaged session is a session that meets any of the following criteria:
- Lasts longer than 10 seconds
- Has a key event
- Has 2 or more screen or page views”
So it has essentially reversed the traditional bounce rate metric.
Pro tip: Bounce rates go up by more than 100% if a page takes more than one second to load. So if you’re seeing a high bounce rate (or low engagement rate), check your page speed score using PageSpeed Insights.
6. Traffic Sources
Traffic sources are a list of all the external channels users are coming to your website from. They include:
- Organic Search - Any search engine like Google, Bing, Yandex, etc.
- Paid Search - Any paid ads you run on search engines, like Google Ads.
- Organic Social - Posts from any account on social media that is not boosted or an ad.
- Paid Social - Paid ad placements on any social media app.
- Direct - When a user directly loads or types a URL into their browser (usually returning visitors).
- Referrals - When users have clicked a link on another website that led them to your site.
- Organic Video - From links to your website on sites like YouTube (not paid ads, think links in video descriptions or comments).
- Paid Other - A catch-all for any other paid ads a user has clicked to find your site.
Although I wouldn’t call this strictly an engagement metric, it’s one of the data points I look at most frequently. A lot of my clients rely on me for services like search engine optimization (SEO) or social media ads. Traffic source is one of the ways I measure the success of my efforts.
Pro tip: You can drill down much further to get more specific information, like which social media app is getting the most clicks or which paid search platform is driving the most traffic.
7. Social Referrals
Social referrals track the referral traffic that comes from social media apps, both organic and paid.
According to Synup, 90% of small businesses are leveraging social media in their 2025 marketing strategy.
To me, this measures engagement with your social media content, rather than focusing on engagement once users reach your site. Where it becomes really useful is seeing growth (indicating that social is a platform worth investing in) and what users from this channel do after they land on the site.
So if I see a decent number of social referrals, and I then track things like average time on page and views per user from this specific channel, I can start to build a full picture of how well my social media efforts are working.
Pro tip: When I'm working on social media campaigns, I often use social listening tools. Combining this information with data from your social referrals metric can help shape your content and engagement strategies.
8. New Visitor Sessions/New Users
New users (formerly new visitor sessions in Google Analytics) measures what proportion of your website traffic is from first-time users. This is the first time these visitors have checked out your site.
I measure new users because it’s a good overall brand awareness metric. When you’re focusing on growth, the more people you can reach, the better. I usually drill down into new users further to see which channels they’re coming from the most. This can help me see which channels are doing well and which might need a little more work.
Or let’s say I’ve launched some campaigns around market entry in a new country. I would pair new users with the users’ countries to see if the brand is getting traction there.
Unique vs. New Visitors
A new visitor means it’s the first time someone has visited the site. But unique users measures how many people visited. It’s similar to impressions versus reach on social media. The same person can visit the website multiple times, which is why your session count is typically higher than your unique user count.
Important note: HubSpot doesn‘t track unique visitors because this metric is based on user behavior and isn’t always reliable. A user may clear their cookies, use a different browser, or block cookies. Because their page views are still tracked, these actions will count toward multiple unique visitors for the same unique visitor.
9. Returning Visitor Sessions
Returning visitor sessions tells you how many sessions are from previous visitors who are returning to the site.
New users are important for growth, but returning visitors show that you’re establishing brand recall. Sites with high returning visitor sessions could have highly loyal customers, put out great content that people want to continue consuming, or be successfully guiding people through a long buyer journey.
If I see a high number here, my attention will turn to conversion rates. People continuing to visit the site is great, but I also want to make sure they’re taking action to fill in forms or make a purchase.
HubSpot Marketing Analytics Software
Measure the performance of all your marketing campaigns in one place with built-in analytics, reports, and dashboards.
- Marketing Analytics
- Dashboard Software
- Website KPIs
- And More!
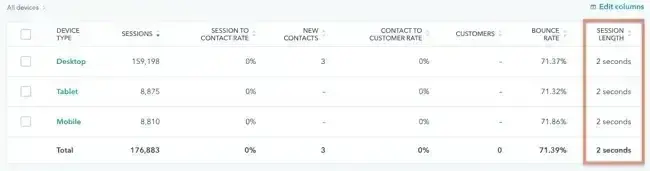
10. Device Type
Device type shows the split of which devices people are using to access your website, broken down into desktop, mobile, and tablet.
You can get even more detail here and see which browsers they used or even operating systems to see Android versus iPhone users.
I like to look at device type for a couple of reasons. One such reason is if the expected user behavior is for mobile devices to be high and it‘s not, I need to look at both the user experience on mobile and how well it’s performing through channels like organic search.
For example, one client I worked with had recently launched an app. So I looked closely at these metrics to make sure we could start to see traffic spikes from mobile and tablets, and specifically tracked sessions within the app itself. GA4 gives great reports on app usage and app stability if you launch one.
11. Conversion Rate
Conversion rate measures the number of conversion activities that happen on your site against your volume of visitors. So if I get 100 website visitors and two of them fill in a form or purchase a product, my conversion rate would be 2%.
This is the website engagement data point that I am mildly obsessed with and the one I pair with other metrics the most. Without it, in many contexts, I might even consider the other metrics on this list pure vanity metrics. In GA4, conversions are known as “key events.”
Conversions basically amount to any action where a user becomes a lead or a customer, such as:
- Becoming a subscriber
- Buying a product
- Filling out a “Contact Me” form
- Providing their email address to download a piece of content
Pro Tip: If you’re tracking this through GA4, I highly recommend setting up custom events for each conversion. GA4 tracks “form_submit” by default, but it’s not the most reliable data capture.
12. Exit Rate
Exit rate is the average percentage of website visitors who exit from pages on your site.
Every page will have an exit rate: no one stays online forever. But, a 100% exit rate on an important page like your homepage can mean performance issues that are worth digging into.
Pro tip: When I look at exit rate or similar metrics, it‘s on a page-by-page basis. If it’s a perfectly natural point for a user to leave the site, then there‘s no problem. But if it’s an important page with lots of important content and CTAs, or I can tell that a particular page is stopping a user mid-journey, it's often time to go back to the drawing board in terms of design and/or content.
13. Top Pages
Top pages is actually a group of metrics, because how it’s measured can vary. For example, on GA4, you can view “Top pages visited” or “top pages by new users.” Conversions are another typical way to measure it. Ultimately, however, it’s a measure of which pages on your website perform best.
I’ll usually look at a couple of the reports I mentioned above. What I’m looking for is what’s not appearing in the list more so than what is there. If I’ve put serious effort into specific pages for Google Search, for example, but a lot of older blog content is in there, I know I need to revisit those pages.
14. Top Exit Pages
Top exit pages shows which pages people visit last before leaving the site.
Alongside exit rate, this is a great way to assess if there are interruptions in the user journey that shouldn’t be there. If a product page is on that list and also has a very low conversion rate? That’s worth looking into.
Pro tip: Even if your top exit pages are what you’d expect to see, I recommend including some calls-to-action on them, like an offer, to try and increase the chance of converting visitors before they leave.
15. Revenue Attribution
Revenue attribution tracks site visitors from when they first land on a website to the point of purchase.
It tracks marketing, sales, and other activities until that user generates revenue. It also tracks how much income that user produces. Marketing attribution is a tricky game. These days, users often need multiple touchpoints to guide them to the purchase decision. Revenue attribution helps you gain insight into what’s truly moving the needle.
Pro tip: I find revenue attribution is a great complement to conversion tracking. While conversion metrics track individual actions, like clicking on a CTA, revenue attribution follows visitors through the full buyer journey, providing me with important insights on how I can boost website revenue generation overall.
16. Event Tracking
Events include the actions that users take on your site, like downloading a resource, clicking a link, submitting a form, and playing a video.
If you head to Reports > Engagement > Events on GA4, you’ll find lots of event metrics to check out. GA4 by default tracks everything from page views to scroll, file downloads, and video views. You can see each of these in the report alongside the event count, total users, and event count per user.
The best thing about this setup is tracking what really matters to your specific business and marketing efforts. For example, if you don’t have many PDF downloads on your website, then the “file_download” metric likely won’t be as important.
Pro tip: I often use Google Tag Manager to set up specific events to track, and it can vary from project to project. For one website, there might be a specific button click I want to pay close attention to. Another one I commonly use is tracking file downloads, especially if there's a lot of valuable content on the site.
How Website Metrics Can Help You Grow Your Website [+ Data]
There’s a lot of information to digest on GA4 or any other website tracking platform. My clients frequently want to stick with just the high-level items and seek my guidance on what’s important and what’s not. I always focus on what these metrics truly mean for business impact, because that’s ultimately the point of having a website.
Website metrics help me:
- Troubleshoot the customer experience.
- Highlight and address pain points.
- Focus on my best content.
Another key area for me is competitor research and benchmarking performance. Am I surpassing industry averages or falling short?
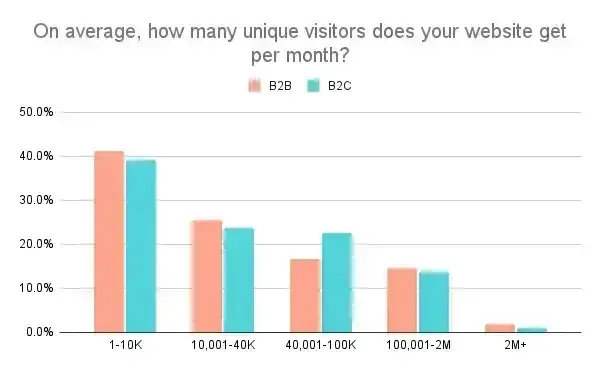
For example, HubSpot research shows that 46% of surveyed businesses saw monthly site traffic between 1,001 and 15K. It also found that the average website gets seven page views per visit and has a bounce rate of 37%.
Choosing the best website metrics for your goals is also important. The chart below shows the metrics that web analysts feel are most important in 2024:
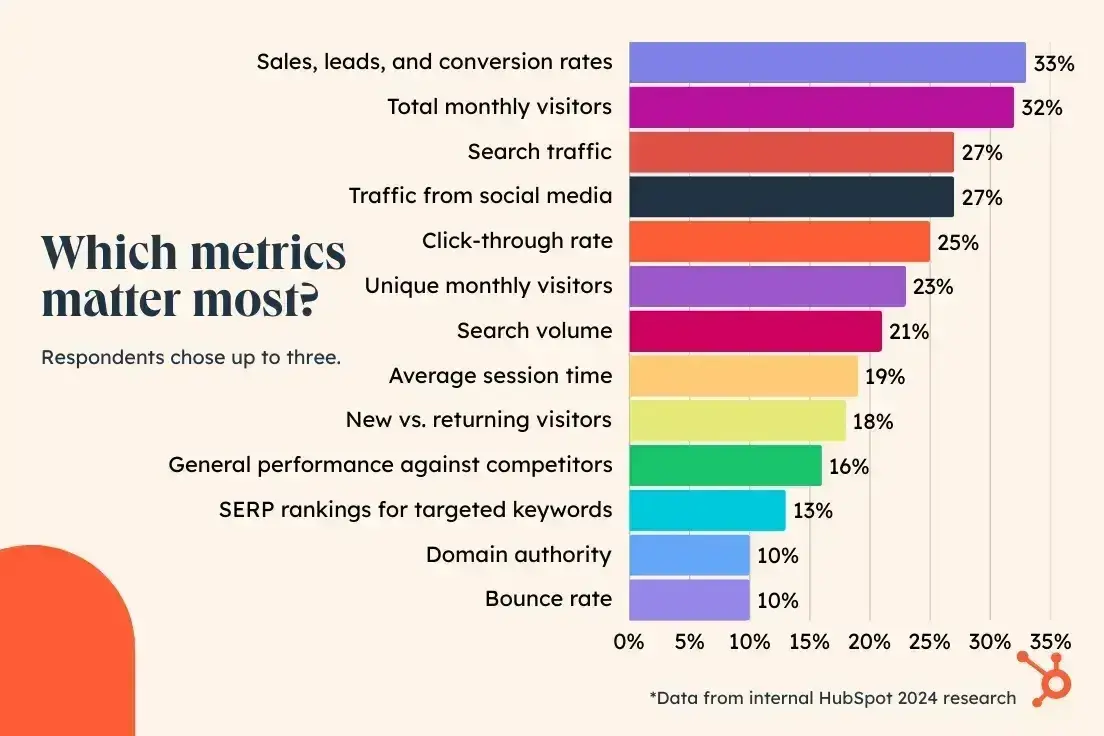
Now that I’ve covered what these metrics mean, let’s take a look at how you can analyze, track, and optimize them in HubSpot.
Before digging into the metrics I plan to measure, here are some of the top questions I want to answer about the website in question.
- Am I hoping to improve traffic or conversions?
- Am I more interested in returning visitors or the newest members of the audience?
- Do I want to make improvements or focus on growth?
Different businesses and websites have different goals. These questions are how I select which metrics to track and combine for a full performance picture.
1. Page Views
How to Analyze Page Views
Page views on their own don’t always tell you much. Typically, I work with clients that fall into one of two categories: either they don’t care about page views at all, or they’re overly focused on it as a success metric.
Page views are a very high-level metric, and they need to be looked at in combination with other factors to be useful. To decide which metrics I’ll combine it with, I’ll ask myself questions like:
- Is this good quality traffic? Here’s where I look at things like time on page and events like “scroll,” for example.
- Is this number rising or falling? If I want to track overall growth, this is where page views come in handy.
- Is this traffic coming from places I expect? Combining page views with traffic source or the user’s country tells me whether specific strategies are working or not.
- Is this normal or below average? Competitor data can help contextualize page views to see whether you’re in the right range.
Pro tip: Competitor data should always be taken with a grain of salt. Firstly, tools can only give you estimates of their traffic numbers. Secondly, just because they’re getting high traffic doesn’t mean it’s high-quality traffic. That’s why page views and conversion rate is a really important combination.
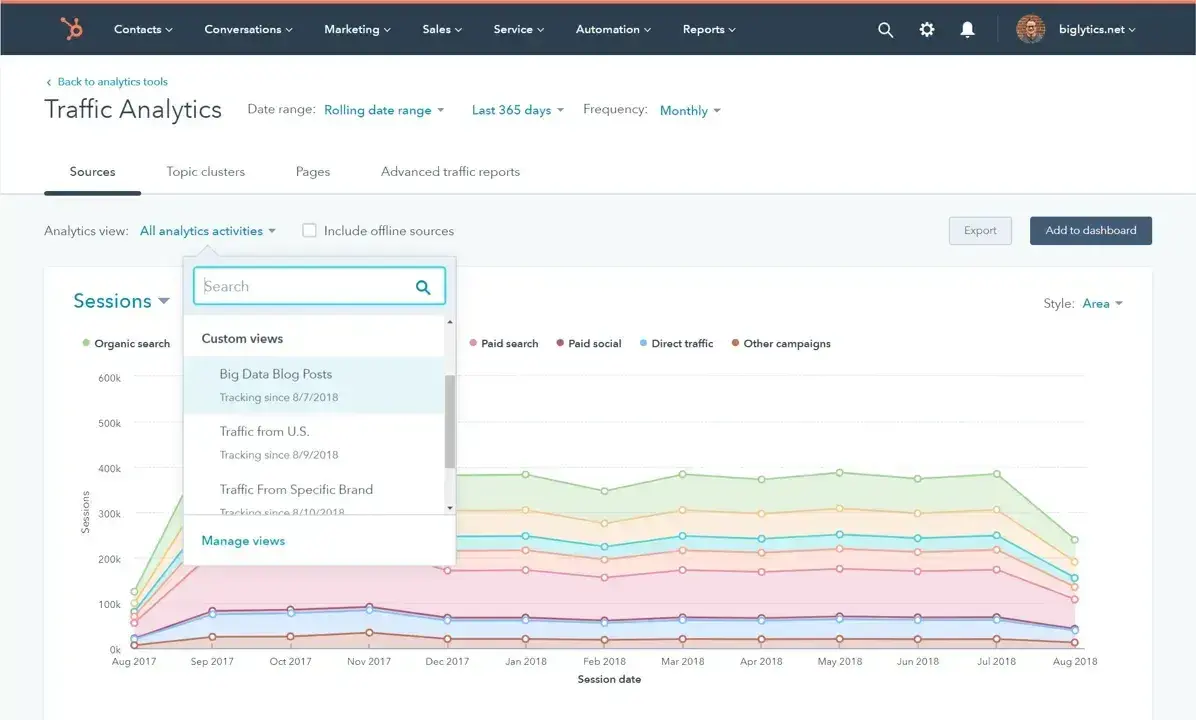
How to Track Page Views
- Log into your HubSpot account.
- Navigate to Reports > Analytics Tools.
- Click Traffic Analytics. You can adjust the date range and frequency (daily, weekly, or monthly) at the top of this page.
- Select the Pages tab.
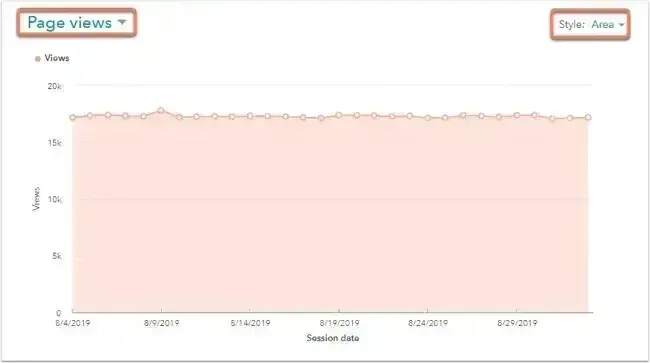
- Select Page Views from the dropdown menu in the upper left of the chart to see how it's changed over time.
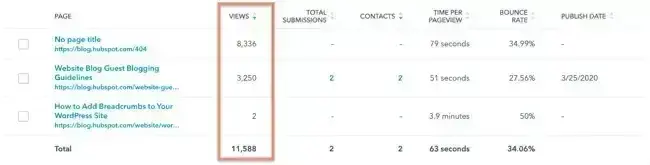
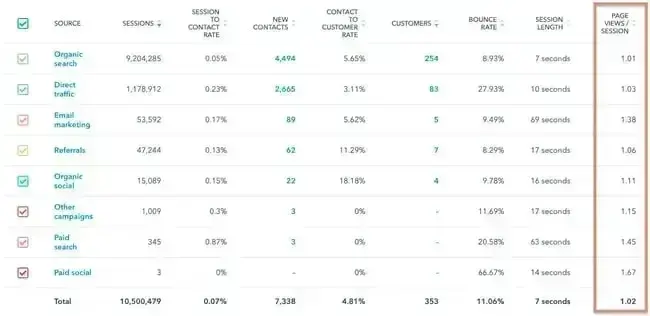
Note: Scroll down to the table below the chart and find the column labeled Views. The total will be listed at the bottom in the row labeled Total.
How to Improve Page Views
Improving page views means ensuring people can find your website more easily out there in the digital world. Take a look at your traffic sources and see which are your top-performing channels and which are low.
You might decide that some channels are worth investing a little more in to maximize results, while some are lower than you expected and need a bigger lift to fix.
For example, I had a client who had been putting a lot of effort into their social media presence, specifically LinkedIn. But company pages don’t always do very well on LinkedIn. So I implemented a thought leadership strategy for the company founder, focusing on their personal LinkedIn page and tagging the company page where relevant. Page views went up, not just from social referrals, but overall because it also increased branded search through Google.
I also recommend taking a look at your internal linking structure. You can also increase your page views by making sure people click beyond whatever page they land on to visit other parts of your website.
2. Average Time on Page
How to Analyze Average Time on Page
According to Contentsquare, the average time on page is 54 seconds. While that‘s a good benchmark, meeting that standard doesn’t mean your average time on page is ideal.
Firstly, remember that this is an average. It’s nearly always worth drilling into further. For example, I expect people to spend only a few seconds on an ad landing page before converting. See our guide to landing page design for pointers on improving this part of your site. But a blog post of 1,500 words should ideally be a couple of minutes.
If you’re relatively happy with your average time on page, the next thing I’d look at is how the number changes over time. For the most part, it should be going up or staying stable. Watch out for sharp drops, which could indicate a performance issue on the site, or a steady decline.
How to Track Average Time on Page
To track average time on page for your website overall, follow the steps below:
- Log into your HubSpot account.
- Navigate to Reports > Analytics Tools.
- Click Traffic Analytics.
- Select the Pages tab.
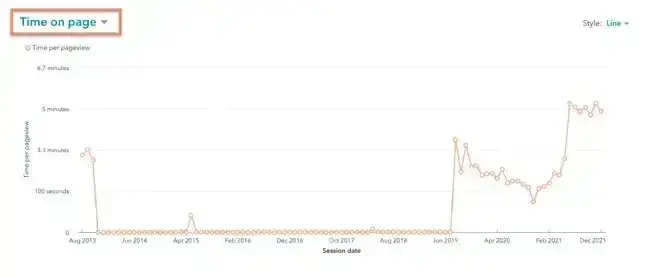
- Select Time on page from the dropdown menu in the upper left of the chart to see how it's changed over time.
Note: Scroll down to the table below the chart for a column view of your data. If you're viewing this information for the first time, you may need to click Edit Columns to add Time on Page to your results. The average will be listed at the bottom in the row labeled Report Total.

How to Improve Average Time on Page
If I find a page that has a low average time on page and it should be higher, there are three main areas I’ll analyze further:
- Is the content and copy good enough? Particularly for long-form content, you need to give people a reason to stay.
- Is the page well laid out? A frustrating user experience can make people scroll quickly and leave. This could be anything from the font size to the color usage on the page.
- Could there be technical issues? Maybe the website is slow and it’s turning people off. Or they’re viewing on a tablet and it’s not well optimized for non-desktop users so the content is difficult to navigate or see.
Sometimes, I eventually figure out it’s a combination of factors. If a few quick tests on performance don’t surface anything, I recommend focusing on the content itself, as that’s usually the culprit.
3. Average Session Duration
How to Analyze Average Session Duration
So visitors are spending 3 minutes and 33 seconds on your site on average. That doesn’t really give you much insight, does it?
I think this is another metric where context and page-specific analysis are important.
If I look at this metric, I usually tie it to specific activities for a “before and after” view. Let’s say I work on a website where the blog content gets a big overhaul. We improve the quality, make sure there’s plenty of internal links, and fix up the main navigation bar. Regardless of what the average session duration was before this project, I want to track it to ensure it’s going up.
How to Track Average Session Duration
- Log into your HubSpot account.
- Navigate to Reports > Analytics Tools.
- Click Traffic Analytics.
- Select the Sources, Topic clusters, UTM Parameters, Device types, Countries, or Browsers tab.
- Select Avg. session length from the dropdown menu in the upper left of the chart to see how it's changed over time.
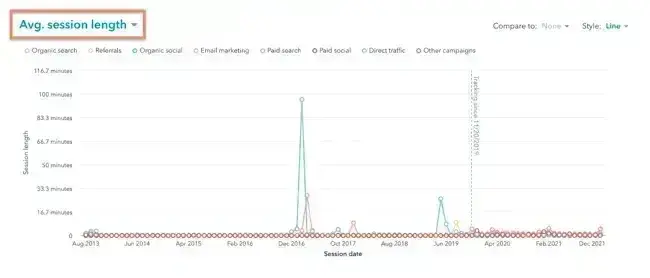
Note: Scroll down to the table below the chart and find the column labeled Avg. Session Length. The average will be listed at the bottom in the row labeled Report Total.
How to Improve Average Session Duration
Unlike time on page, the average session duration is about how long you can keep people on your website as a whole. This could mean less time on multiple pages, depending on your site’s content and purpose.
I find that video embeds can be a good way to get people to linger, but the real key is providing them with a clear and enticing user journey throughout your site.
Focus on calls-to-action, like related posts at the bottom of your content or other well-thought-out internal links.
How you attract the right audience to your site matters, too. 21% of SEOs say optimizing for search intent is the most effective strategy for ranking higher on SERPs.
HubSpot customers: You can improve your pages for search intent using HubSpot's built-in SEO tools.
Another area I focus on is the overall site navigation and structure. When users get confused or struggle to find the information they need, you might see things like rapid clicks to different pages and a short average session duration. So, in this way, it’s a good insight for assessing user experience.
HubSpot Marketing Analytics Software
Measure the performance of all your marketing campaigns in one place with built-in analytics, reports, and dashboards.
- Marketing Analytics
- Dashboard Software
- Website KPIs
- And More!
4. Pages per Session
How to Analyze Pages per Session
Since pages per session shows that visitors want to explore your content and which are most likely to convert, you can use it to figure out conversion paths. I usually start with where visitors are landing on the site before tracking which pages lead them to the exit page.
But the layout and content of the pages someone visits are important. If I’m working on a B2B website, I would expect to see plenty of sessions with just two or three page visits, depending on where they landed. But a clothing ecommerce site should expect a lot more than that.
How to Track Pages per Session
- Log into your HubSpot account.
- Navigate to Reports > Analytics Tools.
- Click Traffic Analytics.
- Select the Sources, Topic clusters, UTM Parameters, Device types, Countries, or Browsers tab.
- Select Page views/session from the dropdown menu in the upper left of the chart to see how it's changed over time.
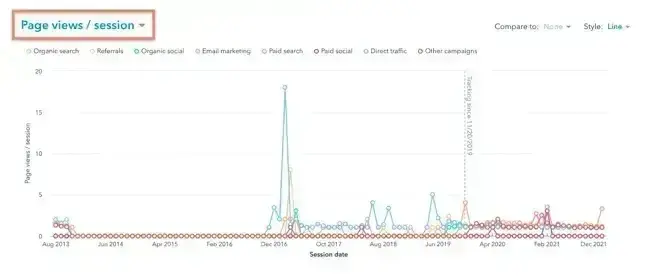
Note: Scroll down to the table below the chart and find the column labeled Page Views/Session. The average will be listed at the bottom in the row labeled Report Total.
How to Improve Pages per Session
One of the quickest ways to increase your Pages per Session count in my experience is adding more prompts to explore the rest of the website. But it can’t be random. So I usually start with core content pillars and how they map to target audiences. It allows you to recommend related content and build user journeys that make sense.
Some useful prompts you can add include:
- Offers
- Related posts recommendations
- Inline links to product pages
5. Bounce Rate
How to Analyze Bounce Rate
A high bounce rate generally means your website is performing poorly. I always take time to dig into this to figure out the reason. There can be a few root causes, such as:
- Confusing navigation
- A mismatch between content and visitor intent
- Hidden or unclear CTAs (or ones that are too “in your face”)
- A broken area of your website
I once worked on a restaurant chain website that had a bounce rate around 90%. It wasn’t unimaginable that users were quickly checking the website for an address or phone number, but the rate was still exceptionally high. When I dug into the site, we discovered it was basically unusable on mobile browsers. After a big project to improve the mobile version of the site, bounce rate came right down.
So it’s not surprising that a survey by Clutch found that 42% of consumers would leave a website because of poor functionality.
How to Track Bounce Rate
- Log into your HubSpot account.
- Navigate to Reports > Analytics Tools.
- Click Traffic Analytics.
- Select the Sources, Topic clusters, UTM Parameters, Device types, Countries, or Browsers tab.
- Select Bounce rate from the dropdown menu in the upper left of the chart to see how it's changed over time.
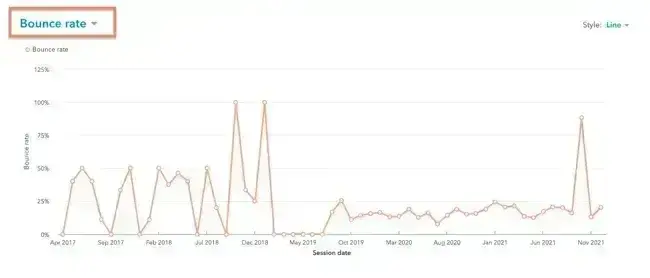
Note: Scroll down to the table below the chart and find the column labeled Bounce Rate. The average will be listed at the bottom in the row labeled Report Total.
How to Improve Bounce Rate
Lowering bounce rate requires identifying the root cause. So I recommend figuring out if there is a specific page, or group of pages, that is contributing to the metric, or if it’s a site-wide issue. This can help identify whether the issue is content, usability, etc. After that, steps to fix it might include:
- Ensuring external links are set to open in new tabs
- Improving page speed scores and page load time
- Optimizing page titles and metadata to better match search intent
For a more in-depth look at best practices, check out this guide to reducing bounce rates for any platform.
6. Traffic Sources
How to Analyze Traffic Sources
Every website relies on external channels to draw in visitors. In your analytics, these external channels are your traffic sources. Most websites rely heavily on organic search to grow and retain visitor numbers. But you might also want to consider social media, email, and referral traffic.
Traffic isn’t the only metric to consider here. I always analyze how well a specific traffic source converts. According to research by FirstPage Sage, organic and email traffic sources have the highest average conversion rates. Organic has a 2.6% conversion rate and email has a 2.4% for B2B businesses.
If I’m working on an SEO project, I’ll always take a look at conversion rates by channel because a low conversion rate for organic search is unusual and might indicate a poor use of keywords, attracting irrelevant traffic.
Phil Vallender, Director at Blend Marketing and HubSpot Elite partner, notes how traffic sources pair with other metrics, like conversion.
He says, “I will always look at sessions, traffic sources, and conversion rates before anything else. When working to improve any of these metrics, many more engagement metrics become relevant and interesting, as they reveal where and how I can improve the customer experience.”
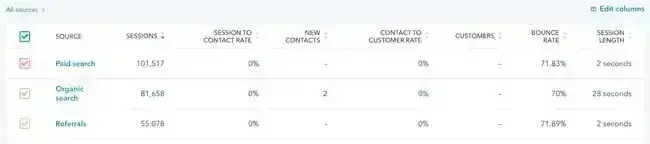
How to Track Traffic Sources
- Log into your HubSpot account.
- Navigate to Reports > Analytics Tools.
- Click Traffic Analytics.
- Select the Sources tab.
- Select different metrics from the dropdown menu in the upper left of the chart to compare multiple sources' data.
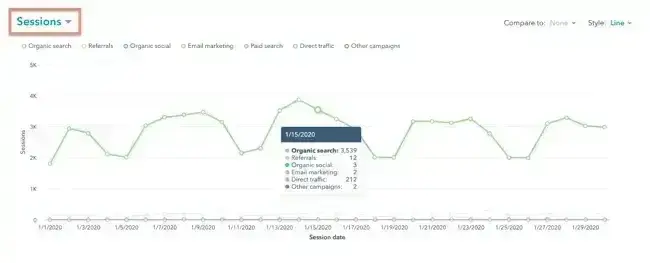
Note: Scroll down to the table below the chart to see the raw metrics based on each source.
How to Improve Traffic Sources
Improving traffic sources essentially comes down to extending your efforts on each specific channel. If social media traffic is low, maybe consider a more regular posting schedule or setting up accounts on new channels like TikTok. If I see low email traffic, I’ll immediately assess what’s being done on email marketing and recommend some adjustments.
For more best practices, check out our guide to diagnosing and fixing traffic drops.
7. Social Referrals
How to Analyze Social Referrals
Social referrals can come from paid ads on social media or your regular, organic posts. I use UTM codes whenever possible so I can track the split between organic and paid social referrals.
HubSpot customers: HubSpot's social publishing tool automatically adds this tracking if there is a campaign associated with your post.
Once you’ve got consistent data, you can start measuring your social referrals. When looking at this metric, I always check two things. First, I look at how much traffic is coming from each referral source page to identify any top performers. Then, I check to see how these referred users go on to engage with the website.
Another important metric I track is the conversions and goal completions from these users. It helps me see how my social media performance is impacting the website and highlights any differences in the user experience between my top channels.
So, although this is technically a measure of engagement with your social content, you can see how social media sessions translate into engagement metrics on your website pages to help refine your overall strategies.
How to Track Social Referrals
- Log into your HubSpot account.
- Navigate to Reports > Analytics Tools.
- Click Traffic Analytics.
- Select the Sources tab.
- Scan the chart to see how social referrals compare to other traffic sources for your website. You can also compare this data with historical data.
- Scroll down to the table below the chart to isolate organic or paid social metrics.
How to Improve Social Referrals
The best use of this metric for me is building and refining a social media strategy. It might lead me down the track of improving the content for each channel or tweaking messaging for different audiences. Or I might use the data to collaborate with the most relevant partners and influencers on social media to increase overall social referrals.
8. New Visitor Sessions
How to Analyze New Visitor Sessions
In most of my work, growth is the most important factor. Businesses work with consultants like me because they have specific goals in mind and need help boosting site performance to get there.
So, when it comes to new visitor sessions, I always look for a consistent upward trend. I’ll also track how this number changes after design changes, SEO updates, and marketing plays. If the number stagnates or goes down, it’s a sign that something isn’t working and I need to reassess.
How to Track New Visitor Sessions
- Log into your HubSpot account.
- Navigate to Reports > Analytics Tools.
- Click Traffic Analytics.
- Select the Sources, Topic clusters, UTM Parameters, Device types, Countries, or Browsers tab.
- Select New visitor sessions from the dropdown menu in the upper left of the chart to see how it's changed over time.
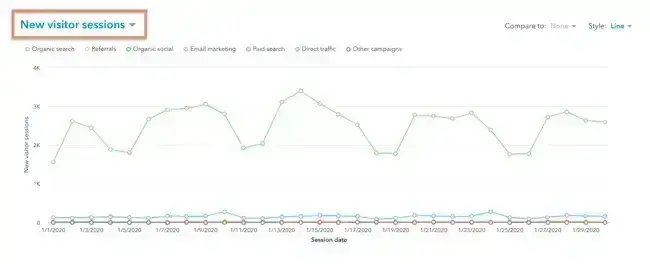
Note: Scroll down to the table below the chart and find the column labeled New Visitor Sessions. The total will be listed at the bottom in the row labeled Report Total.
How to Improve New Visitor Sessions
Increasing new visitor sessions means looking at multiple metrics to figure out how to increase the visibility of your website and awareness of your brand. So pay attention to traffic sources in combination with new visitor sessions to build a better picture.
Ways to improve your new visitor numbers can include:
- Design changes
- SEO or marketing strategy updates
- Generating more backlinks
- Promoting highly targeted content on social media
- Working with influencers to attract new audiences
Other ways to increase this number can include building more real estate on your website to diversify your content. For example, if your website doesn't include a blog, you may want to add a blog to your business website to boost unique visitor numbers.
More resources:
9. Returning Visitor Sessions
How to Analyze Repeat Visitors
Returning visitors is an important measure of your overall marketing effectiveness. When a user first visits your site, they might not be ready to buy or convert right away. But if you see a high number returning, it’s a good indication that your site is clear, the content is good, and they want to know more.
Return visitors can also give you insights into:
- Your most loyal customers
- The products your customers like best
- Content that's most helpful
I usually segment return visitors if I’m building buyer personas for a business. It can help me get a clearer sense of the customers' top needs and pain points.
But another useful way to analyze return visitors is to compare the metric with new visitors. What does that split look like? And do you need to shift the ratio a bit one way or the other? New visitors are good for growth, but repeat visitors give you a sense of how “sticky” your website is. It helps you answer the question: Do first-time visitors find enough value that they want to come back?
There’s a balance to be struck for any website but, in general, I recommend aiming for a repeat visitor rate of 10% (meaning one in 10 visitors is a repeat visitor) to 30%. Lower than 10% could indicate a poor-quality site that does not provide good value to visitors. Higher than 30% means some of your growth strategies are likely stalling.
I will say, there are definitely exceptions to this rule. If you’re a personal injury lawyer, for example, you won’t see nearly as many return visitors as a fashion ecommerce site that has lots of repeat customers. So I will generally try to benchmark this metric by the industry my client is in.
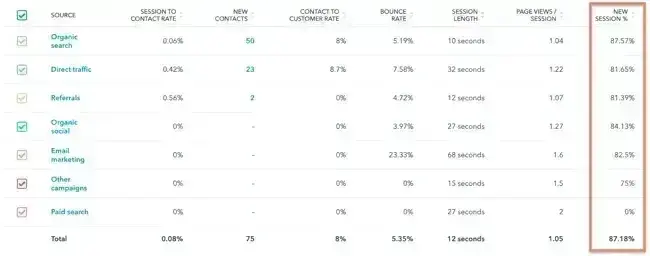
How to Track Repeat Visitors
- Log into your HubSpot account.
- Navigate to Reports > Analytics Tools.
- Click Traffic Analytics.
- Select the Sources, Topic clusters, UTM Parameters, Device types, Countries, or Browsers tab.
- Select New session % from the dropdown menu in the upper left of the chart to see how it's changed over time.
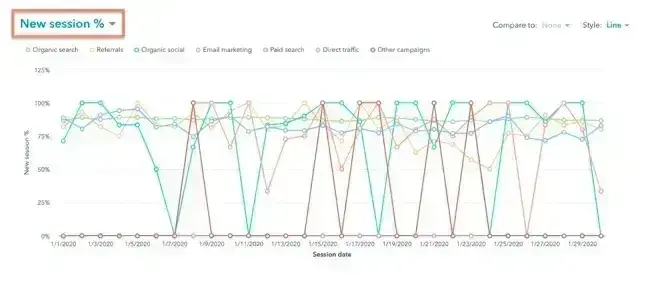
Note: Scroll down to the table below the chart and find the column labeled New Session %. The average will be listed at the bottom in the row labeled Report Total.
How to Improve Ratio of Returning to New Visitors
One of the core strategies I focus on, and one of the best ways to increase new visitors, is organic search optimization and campaigns specifically geared towards new visitors. This could be social media ads to generate awareness or enticing offers to get people to the site. It might also be strategic partnerships within your industry, like paid placements in the email campaigns of publishers.
Finally, getting new visitors is one thing. But it’s important to focus on overall site quality to make sure they return.
Pro tip: Once my campaigns to get new visitors to the site are gaining traction, I often launch strategic retargeting ads to target the best prospects in the returning user audience.
Suzanne Bull, Director of Content and Communications at Cambridge Education Group (Digital), said, "We‘ve looked at improving pages with a high number of new visitors. By providing better links to more top-of-the-funnel content on these pages, we’ve seen an improvement in conversion rates.”
Visitors can take a clearer journey through content they'll value, according to Bull, building trust and keeping them engaged to the point that they inquire.
10. Device Type
How to Analyze Device Type
Device type can seem pretty low priority in the grand scheme of things. But it’s an extremely useful metric for me to track, especially if I need to understand the overall user experience and where site performance needs some work.
I typically take a look at the current split between mobile phone, tablet, or desktop computer, Mac or PC, to get a clearer picture of the users' wants and needs.
Let’s say I see a high number of mobile users, and it corresponds to a high bounce rate in this segment. That’s a classic sign that the site needs evaluation for responsive design principles so it looks great on any device.
For example, I may decide that the mobile version of the website needs a hamburger menu with fewer items in it, or certain elements on the homepage need to be hidden on mobile to improve scroll depth.
Device types can impact conversion, buyer journey flow, and more. Besides tracking my most popular device types, I always check other metrics like bounce rate or CTA clicks. This comparison can help me see how device type is impacting my numbers.
How to Track Device Type
- Log into your HubSpot account.
- Navigate to Reports > Analytics Tools.
- Click Traffic Analytics.
- Select the Device types tab.
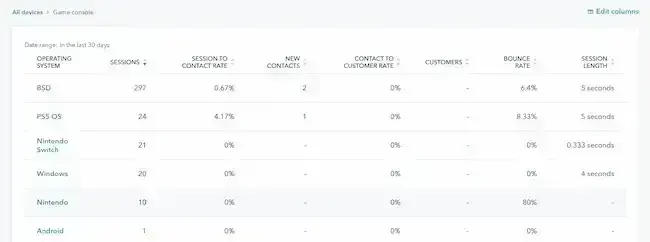
- Scroll down to the table below the chart to see more metrics by device type. You can also click on device type metrics to get operating system information and more.
How to Improve Device Type
While we’re definitely in a “mobile-first” era, I don’t automatically assume that all websites should have predominantly mobile traffic. Most B2B websites I work on still have a much higher proportion of desktop traffic, which makes sense from a user behavior perspective. People tend to be at their desks when researching technology or services that relate to their job or workplace.
That said, mobile devices generate over 64% of traffic online as of 2025. Additionally, 63% of consumers say they prefer to find information about brands with their mobile devices.
If you’re a B2C business and you notice your mobile traffic is low, here are a few ways to get started on improving the experience:
- Test the website yourself on mobile. Do this with different browsers and visit multiple site pages to see if there is a performance or user experience reason behind the low mobile numbers.
- Use PageSpeed Insights and test a sample size of your website pages. This free tool provides scores related to the speed and usability of your site. If you’re seeing low scores, it’s time to optimize your website speed.
Pro tip: Slow websites generally have lower visibility in Google Search and other search engines. Improving mobile page speed also contributes greatly to your overall traffic numbers from this channel.
Device type tracking can also help you measure what users are prioritizing at different points in the buyer journey. Try to analyze page-specific data to measure how top pages perform by device type.
More resources:
- Responsive web design list
- Responsive web design guide
- Optimize website for mobile
- Mobile experience
HubSpot Marketing Analytics Software
Measure the performance of all your marketing campaigns in one place with built-in analytics, reports, and dashboards.
- Marketing Analytics
- Dashboard Software
- Website KPIs
- And More!
11. Conversion Rate
How to Analyze Conversion Rate
Although I track the overall site conversion rate, the most useful way to analyze it is to break it down further. The websites I work on usually have multiple points of conversion, so I’ll compare conversion rates by specific calls-to-action (CTAs) and across different landing pages.
If any are underperforming, my first port of call is revisiting the site design from top to bottom. Maybe the offer is good, but we need to try out different layouts, copy, or CTA text. Or, the problem is the offers themselves, so I’ll switch them out for something more compelling. The conversion path may also be too difficult or confusing, in which case I would try to remove friction for the visitor.
I also break down conversion rates into different subtypes. There are many paths your website visitors take, including visitor-to-lead CVR, lead-to-customer CVR, and visitor-to-customer CVR. This level of detail gives me better insight into where the funnel is doing well, and where it needs improvement.
How to Track Conversion Rate
There are multiple ways to track conversion rates in HubSpot. Let's outline them all below.
- Log into your HubSpot account.
- Navigate to Reports > Analytics Tools.
- Click Traffic Analytics.
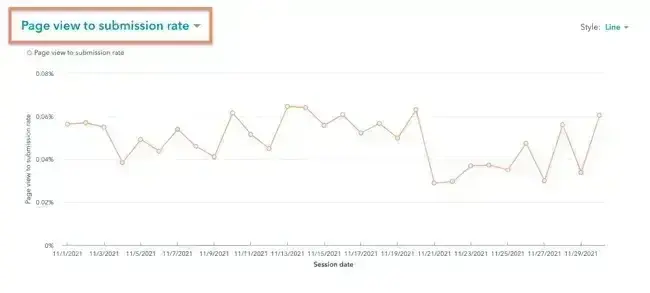
- Select the Pages tab.
- Select Page view to submission rate, Page view to contact rate, or Page view to customer rate, or CTA rate from the dropdown menu in the upper left of the chart to see how it's changed over time.
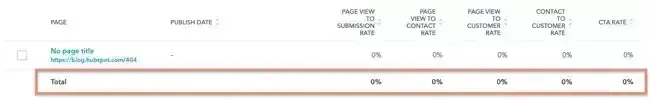
Note: Scroll down to the table below the chart to see each of these metrics based on each page. The averages will be listed at the bottom in the row labeled Report Total.
How to Improve Conversion Rate
Since there are multiple possible reasons for a low CVR, I’ll usually break down the sub-metrics and prioritize my top ideas for how to improve it based on the root cause. Those remedies might include:
- Improving landing page copy and/or layout
- A/B testing CTAs and offers
- Overall site redesign to improve user journeys (especially if the site’s overall CVR is low)
Bull, for example, said that Cambridge Education Group (Digital) is focused on improving its visitor-to-lead CVR: “ With HubSpot analytics, we've been able to identify pages where views are high but conversion is low and made significant improvements to rates by improving CTAs on the page. This has encompassed looking at the CTA design, position on page, and copy.”
Wellers Partner Chris Thompson says his company is also focused on CVR.
“More focus will shift to our conversion rate, specifically our visitor-to-lead conversion rates as well as our visitor-to-client conversions. We are going to bring on new personnel to help write conversion-based content related to our top-performing posts and further design work around our calls to action,” says Thompson.
For a better understanding of all the ways you can improve CVR on your site, check out our guide to conversion rate optimization.
12. Exit Rate
How to Analyze Exit Rate
According to HubSpot research, the average website has a bounce rate 37%. What about a 0% bounce rate? If I see this on a website, it’s a concern, and I’ll immediately check if it’s a sign of technical issues.
It’s important to remember the difference between a bounce and an exit. A bounce is when someone visits one page of your site and leaves without visiting any other pages. An exit is when someone leaves a page, regardless of whether they visited only that page or 10 other pages on your site before that one.
The first thing I do is separate exit rate across different page types (such as landing pages, blog pages, etc.). Are exits happening where I expect them? Or is there a high proportion of drop-off from pages where I’d prefer to see the user continue their journey?
One big red flag for me, for example, is a high number of users landing on the homepage and exiting from the homepage, even if they take the time to scroll through it. This likely means the website is getting irrelevant traffic, or the overall brand positioning, homepage structure, and copy need reworking. It’s all about figuring out what’s going wrong with the user journey.
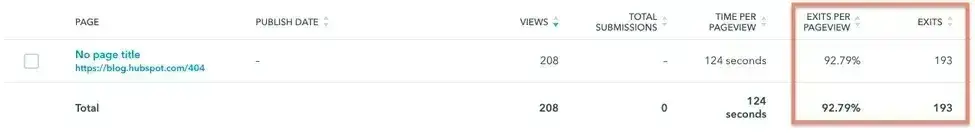
How to Track Exit Rate
- Log into your HubSpot account.
- Navigate to Reports > Analytics Tools.
- Click Traffic Analytics.
- Select the Pages tab.
- Select Exit rate from the dropdown menu in the upper left of the chart to see how this metric changes over time.
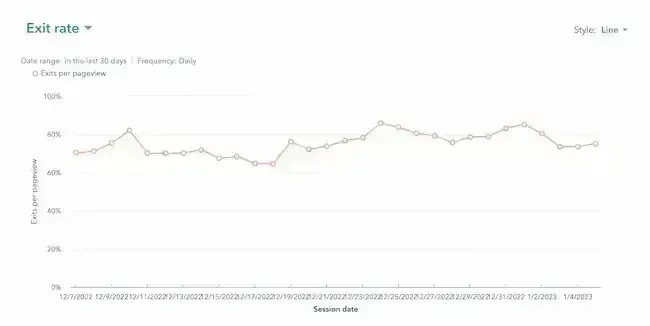
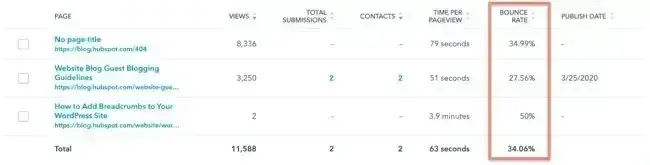
Note: Scroll down to the table below the chart and find the column labeled Exits Per Pageview. The total will be listed at the bottom in the row labeled Report Total.
How to Improve Exit Rate
Everyone has to leave your website at some point. But the goal is to make sure it’s not happening at important points in the user journey. High exit rates on your main website pages or conversion-based pages are website engagement metrics that clearly signal something is not working in the user journey.
I recommend spending some time tracking this data to identify problems you didn’t know users were having across:
- Site performance
- Conversion points
- Messaging and website copy
- Navigation and links to take clear next steps
Once you understand it, you can use exit rate to improve your website experience and conversion funnel.
13. Top Pages
How to Analyze Top Pages
Top pages is another metric that probably won’t mean too much on its own but is good for wider problem solving.
When I’m trying to get to the bottom of how to drive business results on a website, I’ll look at top blog post pages using conversions as the secondary metric. Sometimes there’s a strong correlation between traffic and lead generation, and sometimes not. If I want to assess organic search performance, I’ll look at top pages in conjunction with that specific channel.
What makes this metric useful is in the next steps I take. I recently worked with a business that had exceptional keyword rankings and monthly organic search traffic. But it just wasn’t converting into leads or purchases. We ultimately decided to overhaul the entire content strategy and focus on lower volume, higher value keywords. Organic traffic started to go down, but conversion numbers went up. The pages that were driving the most number of leads didn’t even appear in the top pages by traffic metric.
This is why it’s important to track whether top pages are relevant to your business niche and goals. While it‘s great to get high traffic on your website, if that traffic isn‘t converting, it’s not contributing to business growth.
How to Track Top Pages
- Log into your HubSpot account.
- Navigate to Reports > Analytics Tools.
- Click Traffic Analytics. Select the date range you want to analyze.
- Select the Pages tab.
- Scroll down to the table below the chart and scan the column for the category of top pages you want. You may also want to click Edit columns to select the types of data you want to compare for each page on the list.
- Click Export at the top, to the left of the Save Report button. Then, sort your spreadsheet to analyze your top posts.
How to Improve Top Pages
Top pages is more of an investigative technique than a metric to improve. What I would focus on is improving which pages appear in this analysis.
For example, top pages by traffic and conversions can help inform wider content strategies, like using topic clusters or revisiting conversion rate optimization strategies on pages that should be providing more leads.
14. Top Exit Pages
How to Analyze Exit Pages
Exit pages is like a sub-category of analyzing your overall exit rate. It’s always interesting to see how the exit rate varies across different pages. When I spot a high exit rate on a specific page that I would like to be lower, here are a few things I then investigate:
- Broken links or formatting issues - Are users trying to click through to another page, getting a 404, and leaving the site?
- Unmet user intent - Is the content matching well with user intent?
- Thin or irrelevant content - Do I need to expand the content or clean up the messaging?
- Site structure errors - Is it time to meet with the site developers to fix some technical issues?
- Whether the page is performing as intended - What is my goal for this page, and is that goal being met?
How to Track Exit Pages
- Log into your HubSpot account.
- Navigate to Reports > Analytics Tools.
- Click Traffic Analytics.
- Select the Pages tab.
- Select Exits from the dropdown menu in the upper left of the chart to see how this metric changes over time.
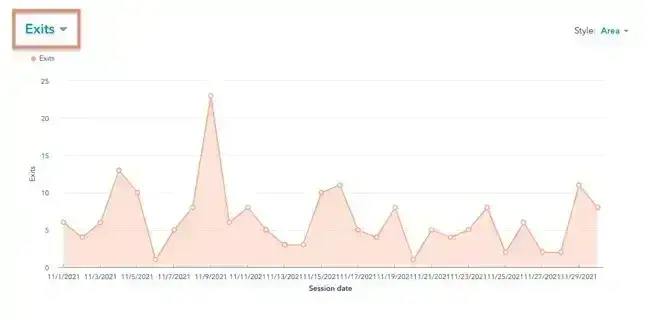
Note: Scroll down to the table below the chart and find the column labeled Exits. You may also want to click Edit columns to select the types of data you want to compare for each page on the list. Then, click Export at the top, to the left of the Save Report button. You can sort your spreadsheet to analyze your top exit pages.
How to Improve Exit Pages
There are lots of strategies I use to make sure a website’s top exit pages are performing how I expect them to. Useful places to start include:
- Finding the right placement for CTAs
- Updating CTA messaging
- Improving and optimizing content
- Tracking page speed
- Building buyer personas to meet user needs
You may also want to use a Website Grader or learn some technical SEO skills to quickly find and fix minor site performance issues.
15. Revenue Attribution
How to Analyze Revenue Attribution
Customers can (and usually do) have many interactions with your brand before they convert or make a purchase. When the path to purchase is a winding road across multiple marketing channels, attributing your marketing efforts to the end result gets very tricky. That's where attribution modeling comes in.
Attribution modeling lets you measure what channels and assets are creating sales opportunities. It’s a way of getting hard evidence on which marketing channels to invest in further to amplify business results and sales.
Christina Kay, formerly the Vice President of Marketing at ResellerRatings, also says that this type of attribution can help you think of the relationship between common website metrics and your bottom line.
"Tracking and measuring revenue, in particular, will help you think of your funnel and give a full view of your website’s goals. That’s because using revenue as an engagement metric combines a lot of the metrics mentioned above,” Kay says.
There are many ways to do marketing attribution — first-touch, last-touch, or multi-source. Each of these has different sub-categories of attribution modeling, and it can get confusing fast.
Revenue attribution reports like those in HubSpot give you insight into which channels are contributing to sales and are a great place to start if you want to look into more complex attribution models.
How to Track Revenue Attribution
To track attributed revenue for all asset types and channels on your site, follow the steps below:
- Log into your HubSpot account.
- Navigate to Reports > Reports.
- Click Create Report in the top right-hand corner.
- Under Create Reports from Scratch, select Attribution.
- Scroll down to Revenue, then select Which parts of web traffic are driving revenue over time?
- Click Next in the top right-hand corner.
- Customize your report with chart types, attribution models, campaigns, and more.
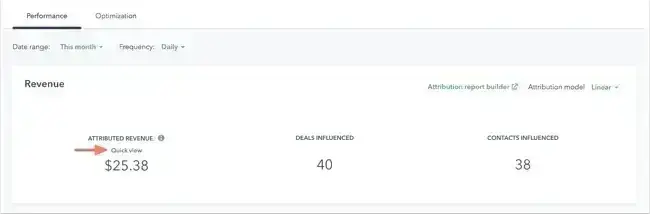
To track attributed revenue for an individual page or post, follow the steps below:
- Log into your HubSpot account.
- Navigate to Marketing > Website > Website Pages or Marketing > Landing Pages or Marketing > Website > Blog.
- Click on a post page or post.
- Scroll to the box labeled Page metrics to see the Attributed Revenue.
How to Improve Revenue Attribution
Attribution reports help show which pages and channels drive the most conversions. I use this metric to help optimize marketing spend and individual channel efforts.
For example, if I’m working with a personal injury lawyer, it might become clear from revenue attribution metrics that social media ads related to road accidents drive the most revenue. But similar ads for work injury claims are not driving the same results. Not only will I double down on marketing spend for car accidents, but I’ll also dive deeper into the metrics for work injury claims content and ad campaigns to see how I can optimize results in that category, too.
Check out our post that includes formulas that can help you calculate web traffic to increase revenue.
HubSpot Marketing Analytics Software
Measure the performance of all your marketing campaigns in one place with built-in analytics, reports, and dashboards.
- Marketing Analytics
- Dashboard Software
- Website KPIs
- And More!
16. Event Tracking
How to Analyze Event Tracking
Event tracking is one of the most important metrics I can look at to assess user engagement with a website. It shows me what people are interested in or ignoring, or where they’re getting stuck. It can also show where they are leaving the customer journey and what I can optimize to help them convert.
One of the most common use cases of event tracking in my work is looking at form fills. I’ll take a look at the form conversion rate on HubSpot and try to identify which people are starting the form but not completing it. It could reveal a broken field, or I might decide to remove a field completely (like phone number) and test the results.
Other important events to track are things like:
- Scroll
- CTA clicks
- Internal link clicks
- File downloads
- Phone calls initiated
- Form submissions
Event tracking paints a clear picture of what users are interacting with on the website and how I can use that information to optimize their journey. It’s another area where A/B testing becomes very useful. I might test CTA button colors or headline copy to see if that improves event frequency, for example.
Matthew Wood, a HubSpot consultant, stressed the importance of this metric.
He said, “When we look at both new websites and the performance of our current clients' websites, one of our main focuses is behavior flow and event tracking. We want to know how the users are moving around the website … Since we have spent time and money getting the user to the website, keeping them on it and getting them to the right pages is just as important.”
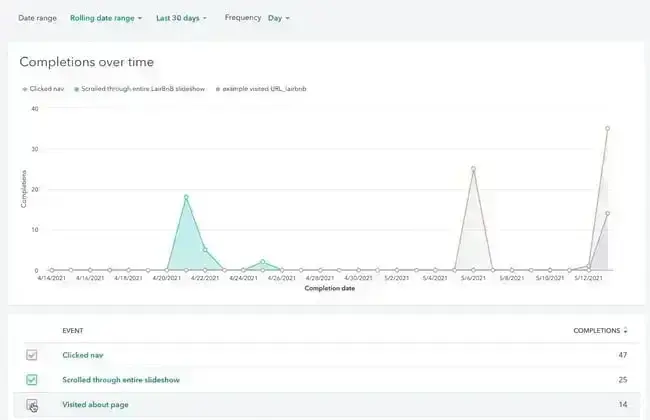
How to Track Events
There are many ways to create custom events in HubSpot. This user guide to creating custom behavioral events has detailed instructions.
How to Improve Event Tracking
Setting up custom events helps you better track specific actions on the website. I do this often when starting work on a new site. The more custom events you set up, the easier it is to investigate engagement issues when they happen.
How you increase event completions depends on the event itself and the reason behind the lack of engagement. But, usually, the decision comes down to removing an element entirely, reorganizing a page layout, or A/B testing to see what improves engagement.
Check out this HubSpot Academy course on creating behavioral events. This can help if you‘re not sure how to track an event that’s unique to your business.
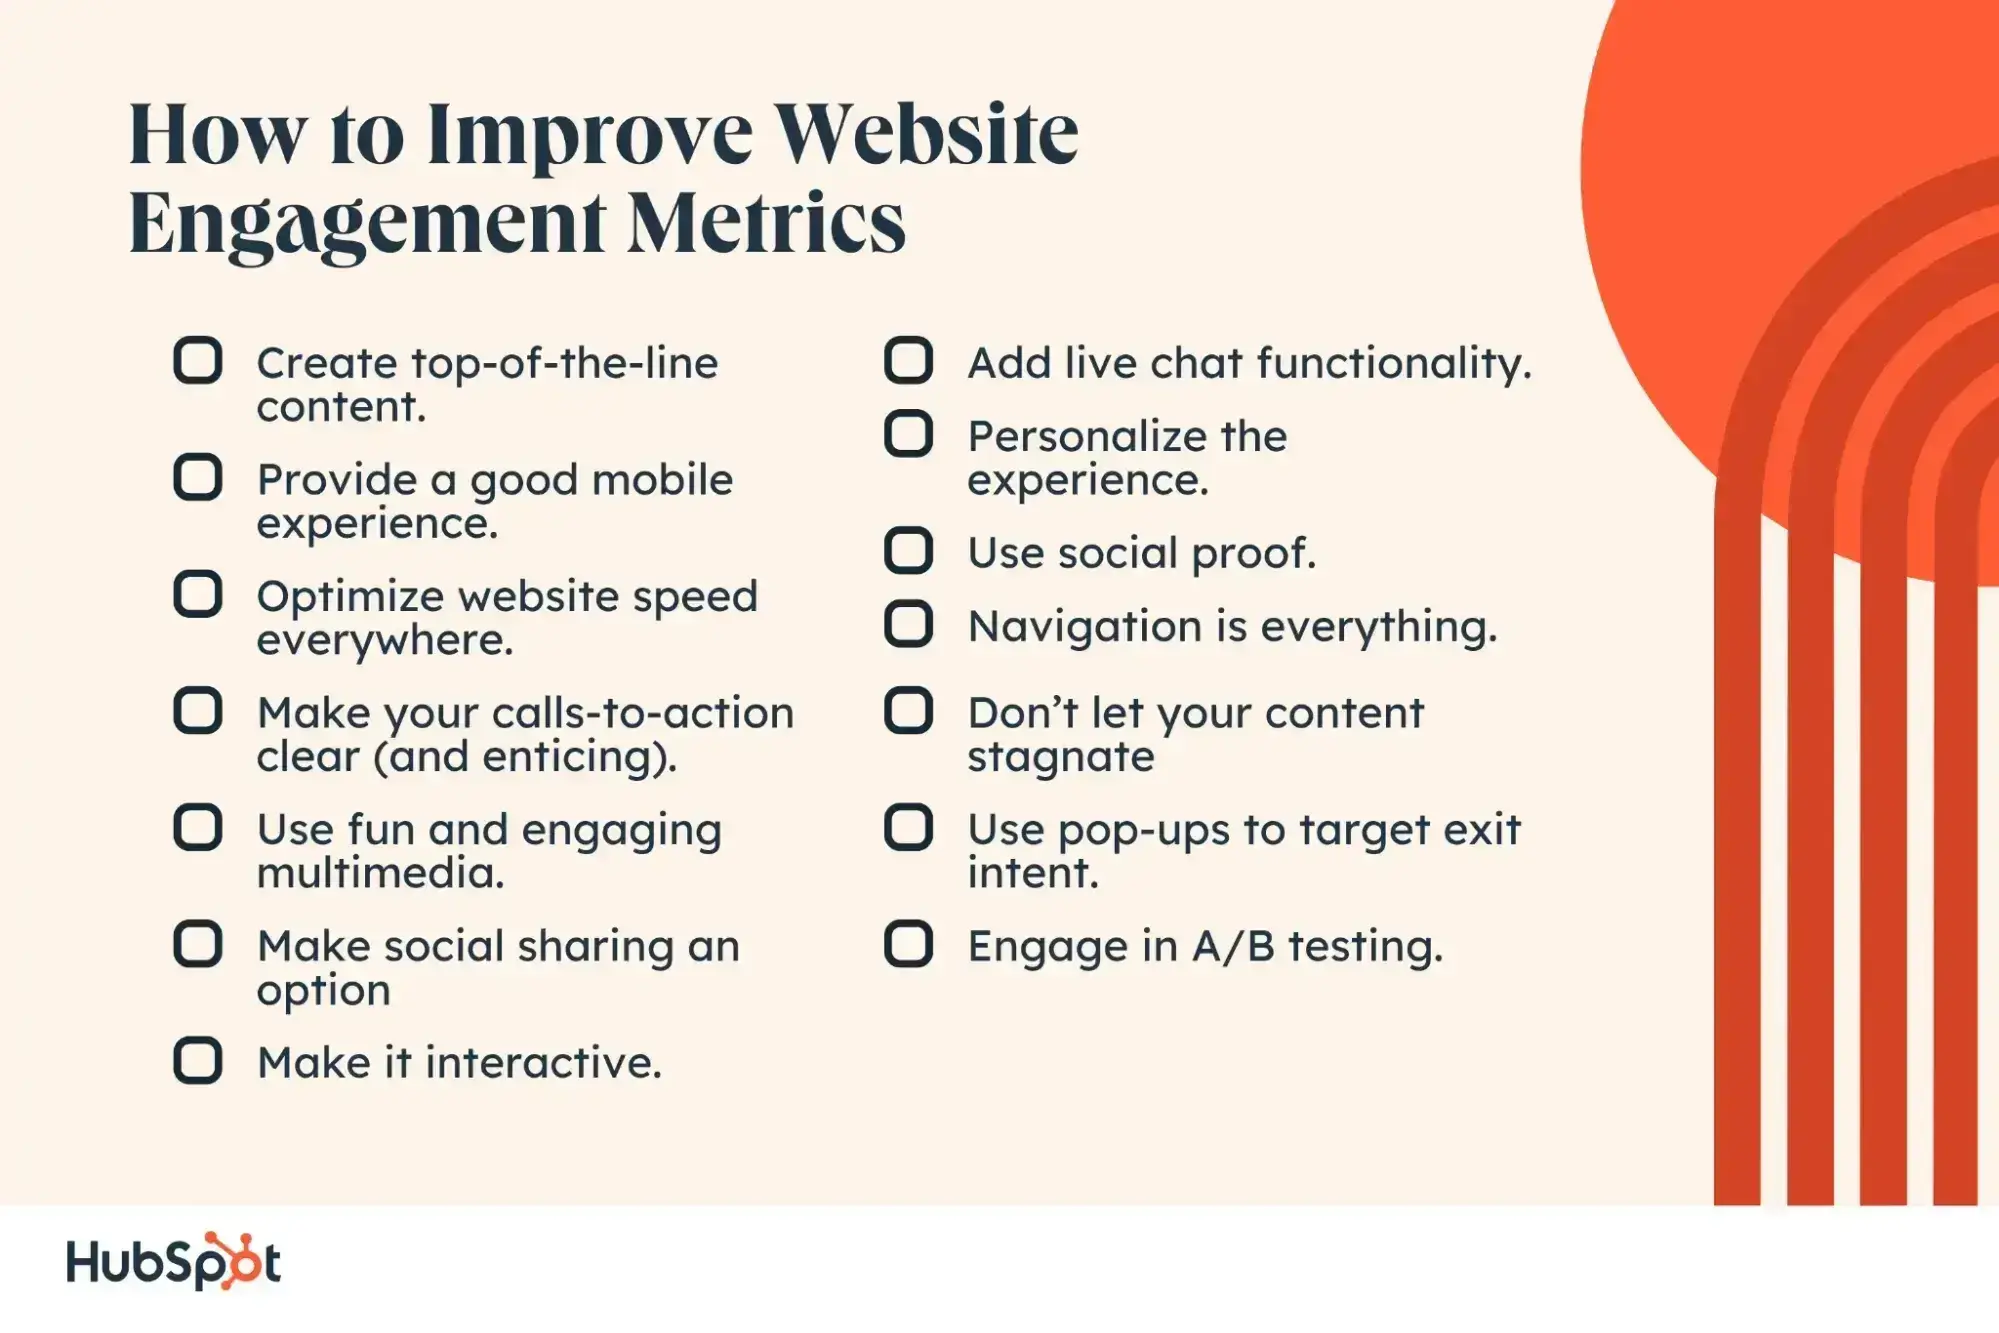
How to Improve Website Engagement Metrics
Marketing analytics dashboards throw a lot of data and metrics at you, so I know it can be hard to know where to start and how to improve them.
Here are a few of my top tips for improving website engagement metrics once you’ve nailed down the ones you want to track more closely.
1. Create top-of-the-line content.
Many of the websites I work on suffer from either thin content or poor quality content. Aside from any design or UX elements, having good quality content is absolutely imperative for website engagement. It’s why you might sometimes see a website with relatively low-quality design that still does quite well in terms of traffic.
So, before you change anything, focus on your content and messaging. I always start here because it’s one of the easier fixes to implement, and it’s the anchor of your entire website. Design rework usually requires more collaborative efforts and expenses.
Plus, I like to change things more gradually sometimes so I can pay attention to metrics and see which changes are actually moving the needle.
Ultimately, users want to engage with websites that are relevant to them, provide useful information, and are easy on the eyes. So, while I know it can be tempting to sacrifice quality for time when it comes to websites, I know it’s worthwhile to build a site that’s solid, well-researched, and thoughtful.
2. Provide a good mobile experience.
As of 2025, over 64% of all internet traffic came through mobile devices — a sharp increase from just over 38% in 2015. “Mobile first” is a reality, and even if you’re a B2B business with a lot of desktop traffic, you should know that poor mobile experiences directly impact your appearance in search engine results.
Here’s what I generally look at to ensure a website provides a good mobile experience:
- Content is readable and all elements are correctly sized and spaced.
- The navigation menu is tailored for mobile and is fully responsive.
- All pages have fast load times and speed.
Websites are typically slower on mobile devices and networks by nature, so I typically use PageSpeed Insights and Lighthouse to identify how I can improve website load times.
3. Optimize website speed everywhere.
Mobile isn’t the only place where your website needs to be fast. Time and again, I see poor website speed and slow-loading content impacting the entire website’s engagement levels. It results in everything from high bounce rates to low conversion rates.
When I conduct a website speed analysis, I take four main considerations into account:
- Is my site properly structured, or is the bulky architecture and code bloat causing it to slow down?
- Should I consider a Content Display Network (CDN) or transition to a new server provider to improve speed?
- Have I fully optimized the on-page content, like videos and images, to reduce their file size?
- Is there an opportunity to apply lazy loading or pagination to improve the load times for on-page content?
I frequently have to work with a more experienced website developer to accomplish better site speed, but it’s entirely worth the investment to improve website performance and engagement.
4. Make your calls-to-action clear (and enticing).
I've tested out a lot of calls-to-action (CTAs) over the years. My biggest tip for you is this: Let your CTA say what it needs to say.
Sometimes, marketers and web developers think they can be clever or sneaky about CTAs, phrasing them vaguely, or even downright dishonestly, to encourage more conversions. Ultimately, this will backfire. Either the user doesn‘t engage at all, or they’ll have a frustrating experience and feel a little duped.
That's not to say I don’t experiment or get a little creative. But a big part of a good user experience is predictability and familiarity. There’s a reason you instinctively know where to click on a website or app. Designers try to build consistent user experiences into digital products because it makes them easier to navigate and, therefore, easier to engage with.

5. Use fun and engaging multimedia.
Don't get me wrong, good copy is absolutely essential. However, when it comes to website engagement, the graphics, images, and videos you use are equally (if not more) important. Before anyone has a chance to read the copy I‘ve crafted, they’ve taken in the look and feel of the website in milliseconds.
Even though I always start with the copy for a webpage, my editing process involves thinking about the following questions:
- Can I take this written copy and create a video to embed on the page to cater to different content preferences?
- Rather than using paragraphs, can I combine these points into an interesting chart or infographic to better guide the user through the information?
- Would some iconography spice up this section of paragraphs?
Pro tip: Try this out with a couple of pages on your site, and keep track of the before-and-after engagement rate. You'll see what a difference this can make.
6. Make social sharing an option.
If you’re looking at metrics like new visitors, event tracking, or social referrals, this is a tactic to consider. Social sharing enables much higher reach for your content. If people think my website is worth sharing with other people, then a quick click of a social sharing button makes it easy for them to do so.
Social sharing brings more visitors to the website. Plus, those visitors are more likely to engage because the content comes recommended by their peers through a social share.
I always aim to include individual social share buttons as a global element on blog posts and articles. I‘ll usually include Pinterest, Facebook, and X (formerly Twitter) at the very least, along with LinkedIn if it’s a B2B website.
Don’t forget email buttons, too. If I’m browsing a website and want to save an article for later, I’ll often email it to myself if the button is available.
7. Make it interactive.
One client I worked with had invested in some marketing videos. They were mostly product explainers for their SaaS solution, but I could see from the engagement metrics that people weren’t clicking “play” that often. When the videos were played, I could see they dropped off after the first 10-20 seconds.
So, we made them interactive. Using an external tool, we rebuilt the videos into a “choose your journey” model so users could click options that appeared on the video to move on to the next section. I also set them to autoplay on page load and briefly experimented with having them pop up on page load. However, this drove down other engagement metrics so I reverted this after a couple of weeks.
This was definitely a more complex interactivity project. But interactivity can be as simple as a hover effect on your CTA buttons or some fun styling on the user’s cursor. Either way, the goal is to keep people on the site and clicking.
Here are some of my other go-tos:
- Embedded quizzes or polls
- Interactive product tours (like 360-degree virtual tours for in-person businesses or real estate sites)
- Calculators or tools embedded right on the page or custom built by a developer
- Interactive timelines for telling your brand story
- Digital flipbooks with interactive elements for your brochures
- Gamified elements like progress bars, badges, or leaderboards, particularly for community-based websites
Pro tip: There is definitely a balance to interactivity. Focus on highlighting things you want users to do as opposed to overwhelming them with effects just for the sake of it. In my experience, quality is preferable to quantity when it comes to interactive elements.
8. Add live chat functionality.
I'm a huge fan of live chat as both a digital marketer and a user. When a website visitor is in a hurry, nothing makes them bounce faster than having to dig around to find what they need.
Live chat, whether run by real people or an AI chatbot, helps them find what they need as quickly as possible. I like using HubSpot's chatbot feature because it's so easy to track the interactions and impact if you use HubSpot as your CRM.
If I’m working on a site with lots of target audiences and use cases for chat, I’ll focus a lot on personalizing the chat experience. For example, if someone is an existing customer, they should be able to access support quickly via the chat, rather than being bombarded with sales CTAs.
9. Personalize the experience.
Speaking of personalization, there are a ton of other ways I like to implement this on websites to boost engagement metrics. There is a lot you can do to personalize a user's experience, and I'll always aim to implement it where I can because it drives engagement metrics up massively.
Personalized marketing is a top trend this year, per our 2025 State of Marketing report. 96% of surveyed marketers reported that personalized experiences increased sales.
One industry that benefits hugely from personalization is ecommerce. I usually use personalized emails and dynamic on-page content in this instance.
Let‘s say I have a certain segment of users who visit my outdoor goods ecommerce store regularly but just don’t seem to engage much or buy anything. I know their age range, location, and general product preferences.
So, I'll use a tool that identifies that they previously looked at hiking equipment and make sure related products are suggested to them, or that something they spent time looking at before is now available at a discount to them.
I know this level of personalization might not always be possible depending on your tech stack. But something as simple as customizing a landing page’s copy based on a user’s location can make a big difference and is easy to accomplish with tools like HubSpot.

10. Use social proof.
You may not always notice it, but seeing customer testimonials, company logos, and reviews on a website makes a difference. I recommend it, no matter the industry or target audience. Social proof puts people at ease, even subconsciously, and can greatly improve website engagement metrics.
Social proof on a website can look like:
- Social media shares
- Product reviews
- Testimonials
- “As seen in” section
- Vanity metrics like page views
- Media appearances
I use them in multiple places on a website, including the homepage. This is not an element you want to bury, but one that a user should see early on in the journey.

Source
11. Navigation is everything.
One of my main goals generally is to make sure a user clicks beyond the first page they land on. There are a few exceptions, but it’s rarely good if someone lands on a homepage and that’s as far as they get.
I wouldn’t worry so much if it was a landing page for paid ads, however. In that instance, I’m paying more attention to conversion rates.
But navigation plays a crucial role in website engagement. It’s how I establish user journeys and track them to make sure visitors are engaged and finding what they need.
I ask questions like:
- Where did they go on the website?
- How long are they spending on specific pages?
- Which journeys are ending in response to a CTA?
- Which are still resulting in a drop-off?
Clear and simple navigation is a must. But I always take it back a step to the user journey and build the navigation from there. It's about leveraging navigation to guide the user through your site, rather than presenting an overwhelming set of options.
12. Don't let your content stagnate.
This is a practice that I use most frequently in relation to organic search performance. Search engines like fresh, up-to-date content to showcase in search results because that’s what users like, too.
I like to make sure information on a website is up-to-date and refreshed so that it aligns as closely as possible with the business’s current offerings. Broken links and outdated information lead to a poor user experience, which ultimately impacts search engine rankings and holds back your marketing and sales efforts as a whole.
Here are a few quick examples:
- Blog content - Are statistics and information up to date? Even older content should reflect changes to products or the industry, especially if it still gets decent traffic.
- Product pages - Are images a true reflection of the current iteration of a product? Have recent reviews been embedded?
- Homepage - Is the copy a reflection of the messaging you’re using in ads and other external platforms?
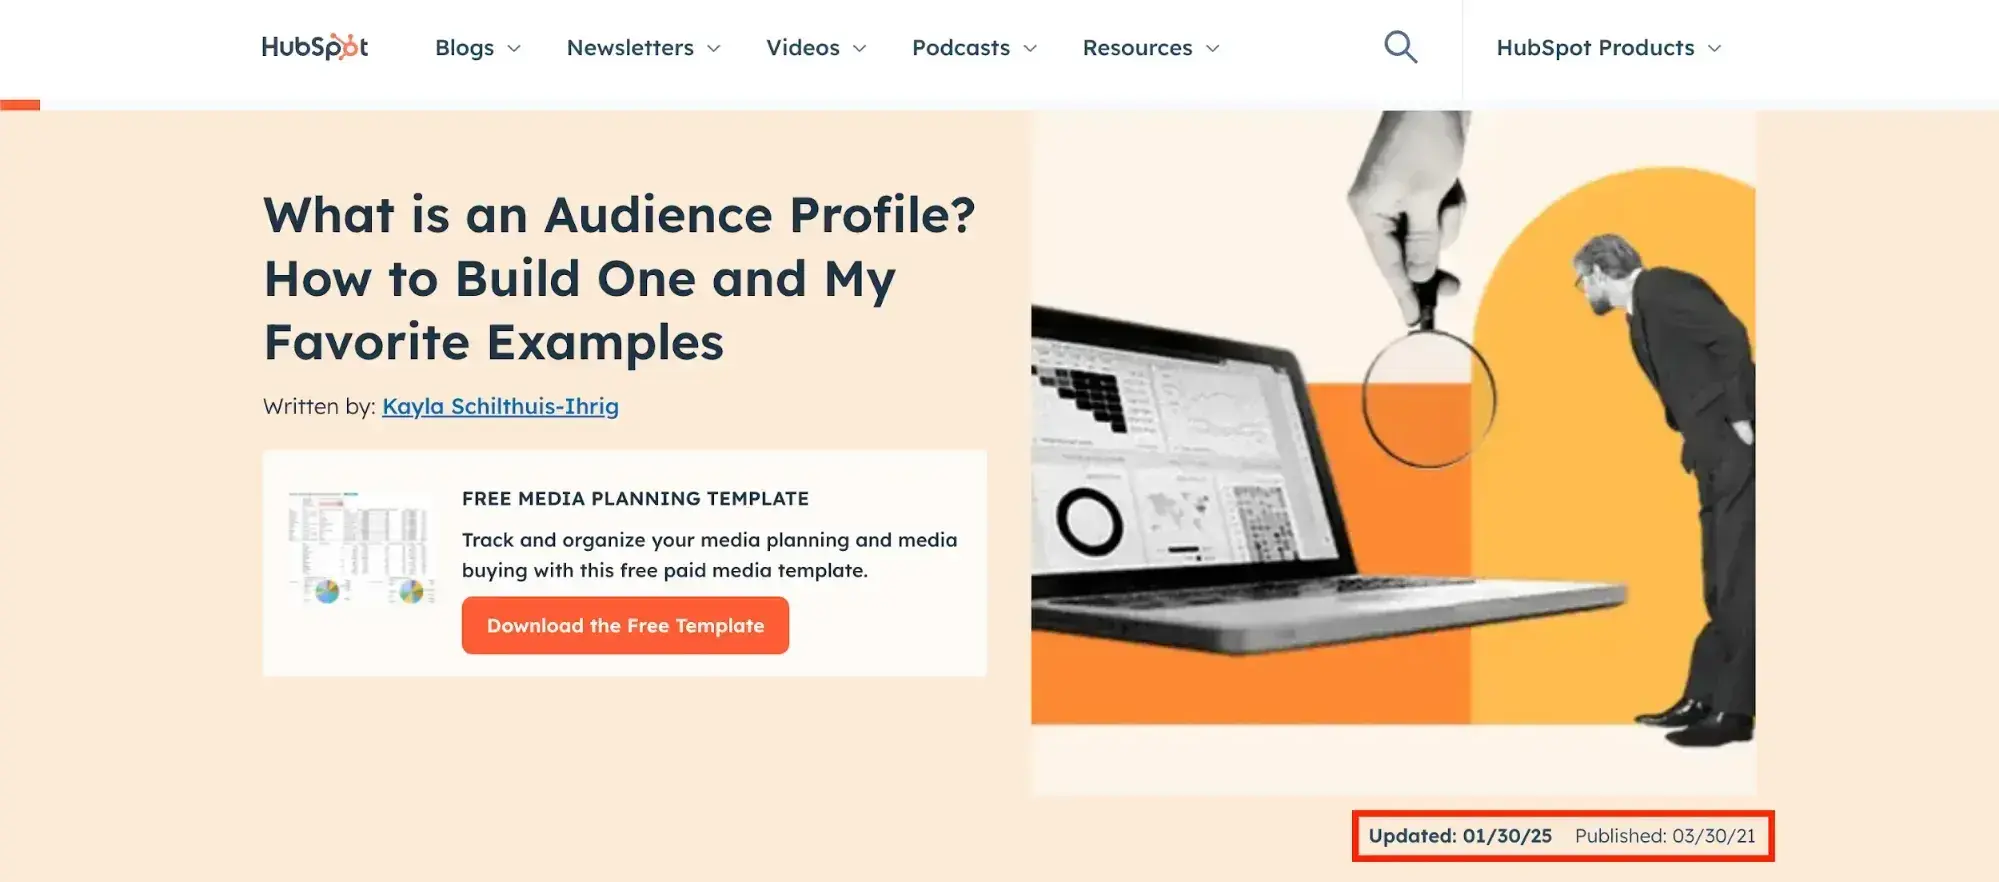
Here's an example from the HubSpot blog where the updated date has been added to show that a post is still current:
13. Use pop-ups to target exit intent.
If it’s possible, I recommend using pop-ups in some form or another on almost every site I work on. If you’re not a fan of the full-page pop-up, I get it. They can be intrusive and a turnoff depending on where you use them. But here are a few other pop-up styles I like to try:
- Slide-in pop-ups in the bottom left or right corner
- “Hello bar” CTAs right at the top of the website page
- Exit intent pop-ups that only appear just as a user is about to leave the site
Here’s an example of an exit intent pop-up from Surfer SEO:

This works because it uses humor and memes creatively, but most importantly, the offer of free access is super compelling. I’ve frequently worked with clients who claim pop-ups don’t work but, when I look at what they’ve tried in the past, the nature of the offer is usually the culprit.
You can use HubSpot’s CTA tool to create beautiful pop-ups to boost engagement on your website.
14. Engage in A/B testing.
What works for one website won‘t necessarily work for all. The tactics I use to maintain and improve engagement metrics can vary from one site to another. Or at least, the way I implement them does. But users can still surprise me, and that’s where A/B testing comes in.
A/B testing means coming up with two different versions of an element and displaying them to different visitors to see which drives more engagement. It's usually a 50/50 split, and you need enough users to have gone through the test to have definitive data on what works best. One good example that I use frequently is A/B testing button colors on a website to see which color drives more clicks.
I frequently test multiple elements on a page, including:
- Site navigation
- Form fields
- CTA copy
- Images and graphics
- Layout
- Element design and colors
HubSpot has A/B testing baked into its platform so you can try it across CTAs, dynamic content, email marketing, and more.
Pro tip: Document your A/B tests carefully and make sure you’re being consistent with your success criteria.
Are your visitors engaged?
Building a website can be tough work, so it’s important to make sure people are engaging with the content you’ve worked hard to create. Website engagement metrics help you assess and optimize your content and design to drive engagement and, ultimately, leads and sales.
A web strategy isn’t much without engagement metrics. So, if you haven’t started crunching the numbers, now's the time.
Editor's note: This post was originally published in May 2021 and has been updated for comprehensiveness.
HubSpot Marketing Analytics Software
Measure the performance of all your marketing campaigns in one place with built-in analytics, reports, and dashboards.
- Marketing Analytics
- Dashboard Software
- Website KPIs
- And More!
Web Analytics
![10 Ecommerce Website Performance Metrics to Track [+Trends & Data]](https://53.fs1.hubspotusercontent-na1.net/hubfs/53/Ecommerce%20Website%20Performance.webp)
![10 Best Tools to Check Website Traffic [+ What They’re Best For]](https://53.fs1.hubspotusercontent-na1.net/hubfs/53/GettyImages-1332148900%20copy.jpg)